

Filling in the GAPS: evaluating completeness and coverage of open-access biodiversity databases in the United States
- PMID: 27547303
- PMCID: PMC4979697
- DOI: 10.1002/ece3.2225
Filling in the GAPS: evaluating completeness and coverage of open-access biodiversity databases in the United States
Abstract
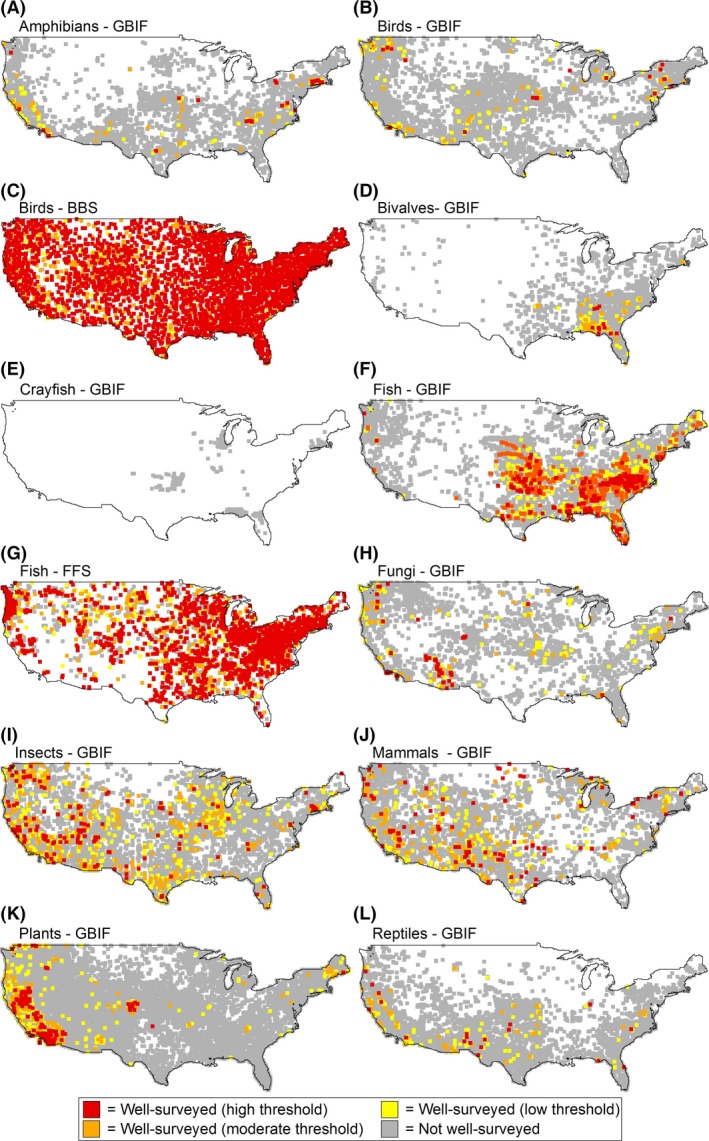
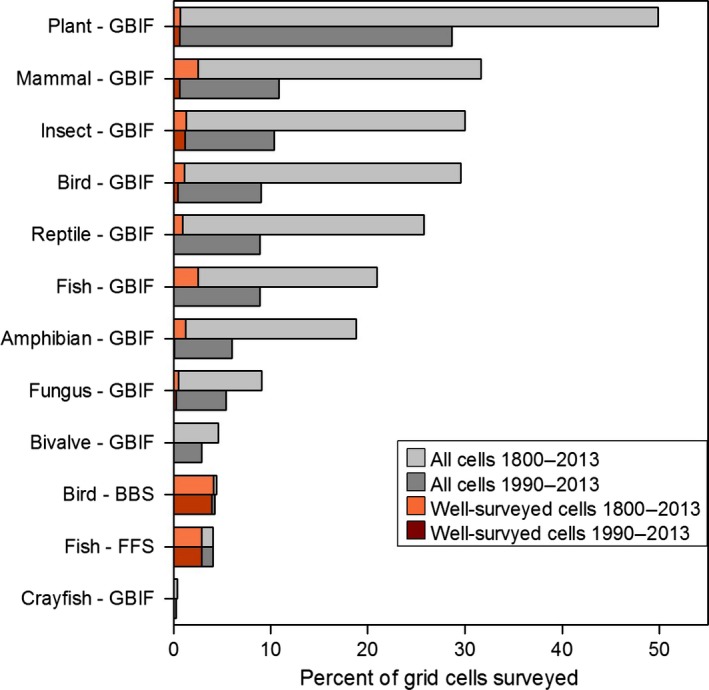
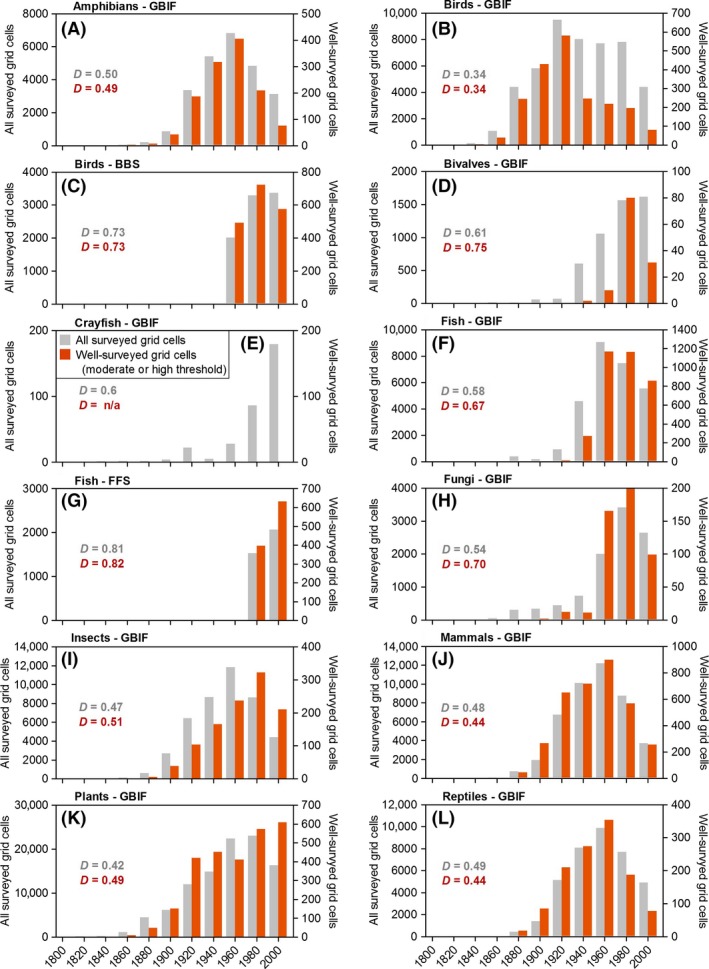
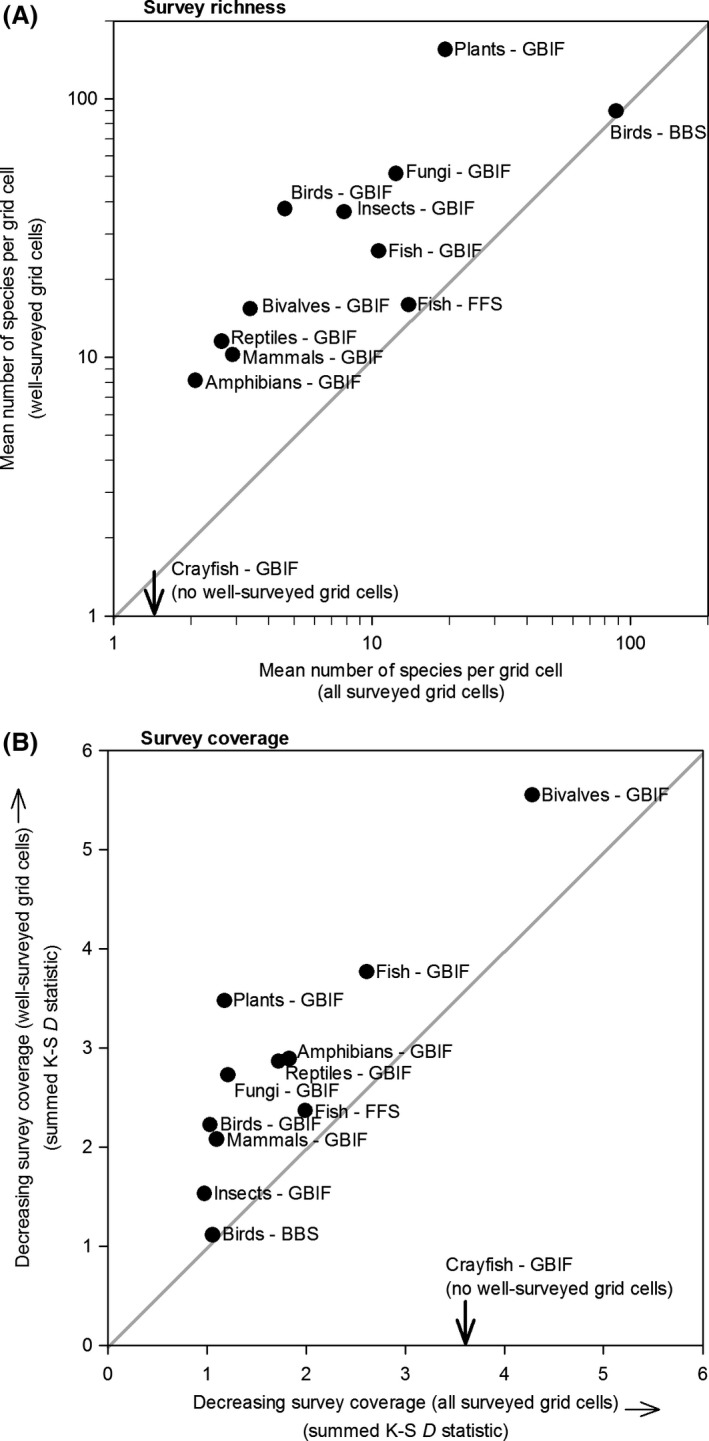
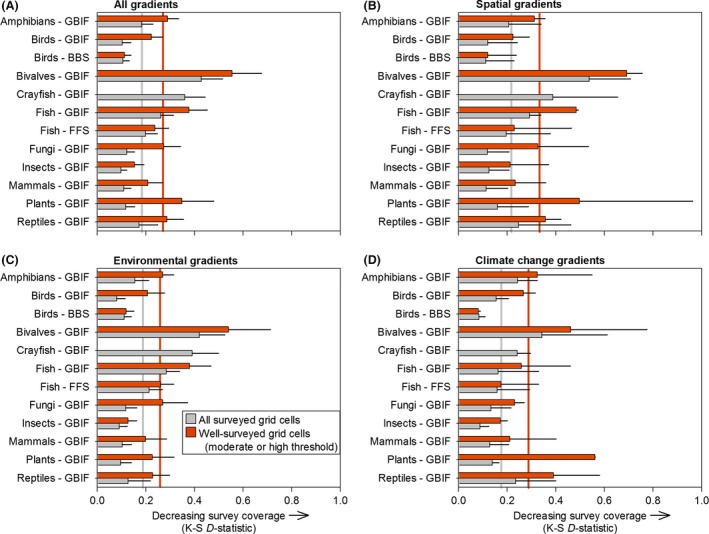
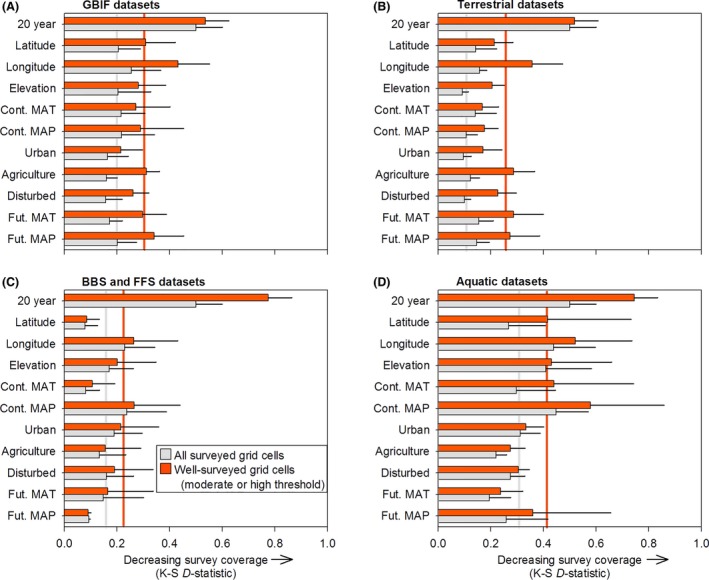
Primary biodiversity data constitute observations of particular species at given points in time and space. Open-access electronic databases provide unprecedented access to these data, but their usefulness in characterizing species distributions and patterns in biodiversity depend on how complete species inventories are at a given survey location and how uniformly distributed survey locations are along dimensions of time, space, and environment. Our aim was to compare completeness and coverage among three open-access databases representing ten taxonomic groups (amphibians, birds, freshwater bivalves, crayfish, freshwater fish, fungi, insects, mammals, plants, and reptiles) in the contiguous United States. We compiled occurrence records from the Global Biodiversity Information Facility (GBIF), the North American Breeding Bird Survey (BBS), and federally administered fish surveys (FFS). We aggregated occurrence records by 0.1° × 0.1° grid cells and computed three completeness metrics to classify each grid cell as well-surveyed or not. Next, we compared frequency distributions of surveyed grid cells to background environmental conditions in a GIS and performed Kolmogorov-Smirnov tests to quantify coverage through time, along two spatial gradients, and along eight environmental gradients. The three databases contributed >13.6 million reliable occurrence records distributed among >190,000 grid cells. The percent of well-surveyed grid cells was substantially lower for GBIF (5.2%) than for systematic surveys (BBS and FFS; 82.5%). Still, the large number of GBIF occurrence records produced at least 250 well-surveyed grid cells for six of nine taxonomic groups. Coverages of systematic surveys were less biased across spatial and environmental dimensions but were more biased in temporal coverage compared to GBIF data. GBIF coverages also varied among taxonomic groups, consistent with commonly recognized geographic, environmental, and institutional sampling biases. This comprehensive assessment of biodiversity data across the contiguous United States provides a prioritization scheme to fill in the gaps by contributing existing occurrence records to the public domain and planning future surveys.
Keywords: Biodiversity; Global Biodiversity Information Facility; National Rivers and Streams Assessment; National Water Quality Assessment; North American Breeding Bird Survey; Regional Environmental Monitoring and Assessment Program; Wallacean shortfall; museum collections; species distribution modeling.
Figures
References
-
- Bahn, V. , and McGill B. J.. 2007. Can niche‐based distribution models outperform spatial interpolation? Glob. Ecol. Biogeogr. 16:733–742.
-
- Bates, B. C. , Kundzewicz Z. W., Wu S., and Palutikof J.. 2008. Climate Change and Water. Technical Paper of the Intergovernmental Panel on Climate Change, IPCC Secretariat, Geneva.
-
- Beck, J. , Ballesteros‐Mejia L., Nagel P., and Kitching I. J.. 2013. Online solutions and the ‘Wallacean shortfall’: what does GBIF contribute to our knowledge of species’ ranges? Divers. Distrib. 19:1043–1050.
-
- Bennett, E. M. , Carpenter S. R., and Caraco N. F.. 2001. Human impact on erodable phosphorus and eutrophication: a global perspective increasing accumulation of phosphorus in soil threatens rivers, lakes, and coastal oceans with eutrophication. Bioscience 51:227–234.
-
- Brito, D. 2010. Overcoming the Linnean shortfall: data deficiency and biological survey priorities. Basic Appl. Ecol., 11, 709–713.
LinkOut - more resources
Full Text Sources
Other Literature Sources
