Review
. 2015 Jul-Aug;2(4):329-344.
doi: 10.1002/wat2.1079. Epub 2015 Mar 11.

Increasing river floods: fiction or reality?

Affiliations
Review

Increasing river floods: fiction or reality?

Günter Blöschl et al. WIREs Water. 2015 Jul-Aug.

Abstract

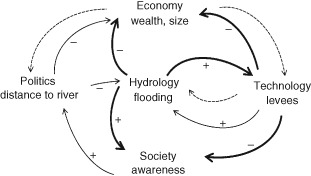
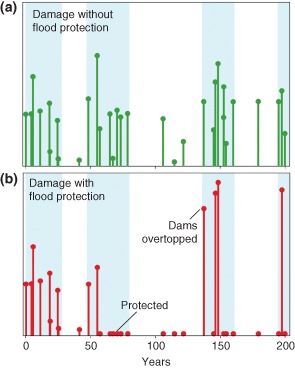
There has been a surprisingly large number of major floods in the last years around the world, which suggests that floods may have increased and will continue to increase in the next decades. However, the realism of such changes is still hotly discussed in the literature. This overview article examines whether floods have changed in the past and explores the driving processes of such changes in the atmosphere, the catchments and the river system based on examples from Europe. Methods are reviewed for assessing whether floods may increase in the future. Accounting for feedbacks within the human-water system is important when assessing flood changes over lead times of decades or centuries. It is argued that an integrated flood risk management approach is needed for dealing with future flood risk with a focus on reducing the vulnerability of the societal system. WIREs Water 2015, 2:329-344. doi: 10.1002/wat2.1079 For further resources related to this article, please visit the WIREs website.


Figures

Figure 1
Figure 1
Two examples of river floods: (a) rain flood in Paznaun, Tyrol, August, 2005 and (b) ice jam flood in Vienna, Austria, March, 1830.
Figure 2
Figure 2
Maximum annual floods (i.e., the largest runoff in every year) for the Danube at Vienna between 1828 and 2013. (Reprinted with permission from Ref 3. Copyright 2013). Publisher is Österreichischer Ingenieur‐ und Architekten‐Verein.
Figure 3
Figure 3
Summary of trends in flood peak runoff in the last decades in Europe obtained from different studies and study periods. Upward pointing arrows indicate increasing trends and downward pointing arrows represent decreasing trends. Both are related to the majority of trends in a region. No arrows are shown in areas with inconclusive data and/or results (Reprinted with permission from Ref 2. Copyright 2014). Published by Copernicus Publications on behalf of the European Geosciences Union.
Figure 4
Figure 4
Periods with frequent and less frequent flooding in Europe for selected periods between 1560 and 1810 (Reprinted with permission from Ref 10. Copyright 2010). Published by Copernicus Publications on behalf of the European Geosciences Union.
Figure 5
Figure 5
Annual flood losses in Europe from major flood disasters: (a) raw data and (b) data corrected for inflation as well as for changes in population and wealth (Reprinted with permission from Ref 17. Copyright 2009). Published by Copernicus Publications on behalf of the European Geosciences Union.
Figure 6
Figure 6
Smoothed annual series of observed (a) air temperature and (b) precipitation for subregions of Austria based on the HISTALP data set. Colors relate to different regions within Austria; black colors in (a) to a few mountain stations (Reprinted with permission from Ref 25. Copyright 2011). Publisher is Springer.
Figure 7
Figure 7
Precipitation and flood seasonality across the Alpine–Carpathian range. (a) Mean date within the year the maximum daily precipitation occurred. (b) Mean date within the year the maximum flood runoff occurred. Observed data from 1961 to 2000 (Reprinted with permission from Ref 27. Copyright 2010). Publisher is Elsevier.
Figure 8
Figure 8
Event precipitation and runoff depths for the largest events on record in the Kamp catchment at Zwettl, Austria (Reprinted with permission from Ref 31. Copyright 2007). Published by Copernicus Publications on behalf of the European Geosciences Union.
Figure 9
Figure 9
Effect of afforestation and deforestation on changes in the flood peak runoff for the 622 km2 Kamp catchment at Zwettl, Austria, based on rainfall‐runoff simulations. The baseline is 47% forest cover, afforestation increases it to 86%, and deforestation decreases it to 0% (remaining area is pasture and cropland). Events are stratified by the soil moisture at the beginning of the event as wet and dry (Reprinted with permission from Ref 34. Copyright 2012). Published by Copernicus Publications on behalf of the European Geosciences Union.
Figure 10
Figure 10
Hypothesised impact of land‐use and climate variability on flood magnitudes as a function of scale (Reprinted with permission from Ref 38. Copyright 2007). Published by John Wiley and Sons.
Figure 11
Figure 11
Schematic of flood plain effects on the flood hydrograph: (a) map view of a river reach with water moving from the main channel (dark blue line) out onto the flood plain and moving back to the main channel, and (b) inflow and outflow hydrograph of the reach. Flood plain retention reduces the flood peak. The magnitude of the reduction is mainly controlled by the retention volume.
Figure 12
Figure 12
Change in the winter precipitation (December to February) from 1860 to 2100 relative to 1961–1990 in the greater Alpine area. Grey shading and red (median): 15 global ocean–atmosphere models for the IPCC SRES A1B scenario. Green: Histalp observations (Reprinted with permission from Ref 25. Copyright 2011). Published by Springer.
Figure 13
Figure 13
Simulated frequency of floods for two regions: (a) Tyrol and (b) Mühlviertel, Upper Austria. Current conditions (black) and scenario (red) (Reprinted with permission from Ref 48. Copyright 2011). Publisher is Springer.
Figure 14
Figure 14
Loop diagram showing how hydrological, economical, political, technological, and social processes are all interlinked and gradually (continuous thin arrows) coevolve, while being abruptly (continuous thick arrows) altered by the sudden occurrence of flooding events. Dashed arrows indicate more indirect control mechanisms (Reprinted with permission from Ref 18. Copyright 2013). Published by Copernicus Publications on behalf of the European Geosciences Union.
Figure 15
Figure 15
Two scenarios of flood damage for a hypothetical city: (a) flood management options involve the choice of building close or far away of flood prone river but no levees and (b) flood management options also involve the construction of levees. Light blue areas indicate flood‐rich periods, white areas flood‐poor periods. Results from the sociohydrology model of Refs 18 and 52.
Figure 16
Figure 16
A black swan among numerous white swans is unexpected but may be the important one. There is a potential for Black Swan events in hydrology that are unexpected but have high impact from a societal point of view. Available at: http://www.lonelyplanet.com/japan/hokkaido/images/black‐swan‐among‐white‐swans‐hokkaido$24256‐1.

References

    1. Viglione A, Rogger M. Flood processes and hazards In: Paron P, Di Baldassarre G, Shroder JF, Jr, eds. Hydro‐Meteorological Hazards, Risks, and Disasters. Amsterdam: Elsevier; 2015.
    1. Hall J, Arheimer B, Borga M, Brázdil R, Claps P, Kiss A, Kjeldsen TR, Kriaučiūnienė J, Kundzewicz ZW, Lang M, et al. Understanding flood regime changes in Europe: a state of the art assessment. Hydrol Earth Syst Sci 2014, 18:2735–2772. doi:10.5194/hess-18-2735-2014. - DOI
    1. Blöschl G, Nester T, Komma J, Parajka J, Perdigão RAP. Das Juni‐Hochwasser 2013—Analyse und Konsequenzen für das Hochwasserrisikomanagement (The June 2013 flood—analysis and implications for flood risk management). Z Österreich Ingen‐&‐Architekten‐Ver 2013, 158:141–152.
    1. Kundzewicz ZW, ed. Changes in Flood Risk in Europe. IAHS Special Publ. No. 10 Wallingford: IAHS Press; 2012, 516 + xvi pp.
    1. Brázdil R, Kundzewicz ZW, Benito G. Historical hydrology for studying flood risk in Europe. Hydrol Sci J 2006, 51:739–764.

LinkOut - more resources