. 2017;2(1):8.
doi: 10.1186/s40679-016-0021-2. Epub 2016 Jun 28.

3D reconstruction of biological structures: automated procedures for alignment and reconstruction of multiple tilt series in electron tomography

Affiliations

3D reconstruction of biological structures: automated procedures for alignment and reconstruction of multiple tilt series in electron tomography

Sébastien Phan et al. Adv Struct Chem Imaging. 2017.

Abstract

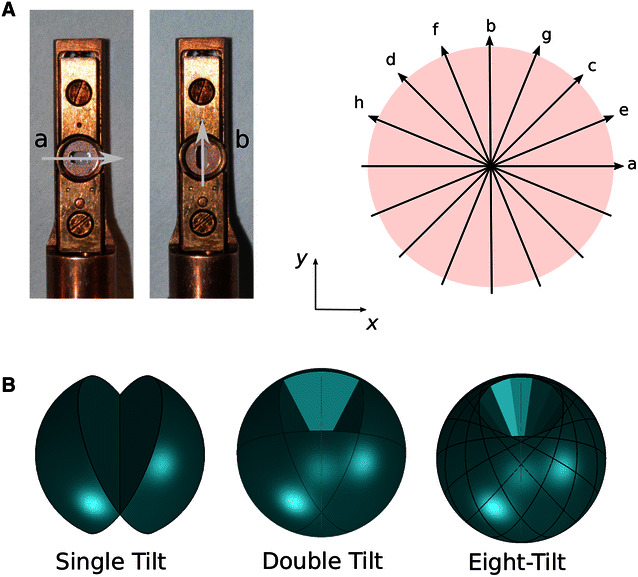
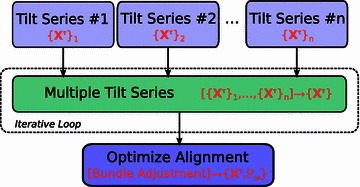
Transmission electron microscopy allows the collection of multiple views of specimens and their computerized three-dimensional reconstruction and analysis with electron tomography. Here we describe development of methods for automated multi-tilt data acquisition, tilt-series processing, and alignment which allow assembly of electron tomographic data from a greater number of tilt series, yielding enhanced data quality and increasing contrast associated with weakly stained structures. This scheme facilitates visualization of nanometer scale details of fine structure in volumes taken from plastic-embedded samples of biological specimens in all dimensions. As heavy metal-contrasted plastic-embedded samples are less sensitive to the overall dose rather than the electron dose rate, an optimal resampling of the reconstruction space can be achieved by accumulating lower dose electron micrographs of the same area over a wider range of specimen orientations. The computerized multiple tilt series collection scheme is implemented together with automated advanced procedures making collection, image alignment, and processing of multi-tilt tomography data a seamless process. We demonstrate high-quality reconstructions from samples of well-described biological structures. These include the giant Mimivirus and clathrin-coated vesicles, imaged in situ in their normal intracellular contexts. Examples are provided from samples of cultured cells prepared by high-pressure freezing and freeze-substitution as well as by chemical fixation before epoxy resin embedding.

Keywords: 3D reconstruction; Electron tomography; Iterative methods; Tomogram averaging; TxBR.


Conflict of interest statement

The authors declare that they have no competing interests.

Figures

Fig. 1
Fig. 1
Protocol for acquiring multiple tilt series. A Between each series, the sample is rotated within the goniometer holder (left side) following an orientational multilevel access scheme (MAS) that optimizes the reconstruction space sampling. The tilt axis is displayed schematically for the 8-tilt series case (right side); series are labeled with letters from ‘a’ to ‘h’. The first and last series ‘a’ and ‘h’ correspond to a 0°–157.5° sample orientation, respectively. B 3D illustration representing the increase in accessible volume information as the number of tilt series augments
Fig. 2
Fig. 2
TEM micrograph of a plastic section containing Mimivirus virions infecting a cell culture at 4h post infection. The sample is at zero tilt; 5-nm gold particles (G) are used as fiducial markers for aligning the tilt series. The enclosed area corresponds to the capsid envelope portion displayed in Fig. 3
Fig. 3
Fig. 3
Mimivirus reconstruction: comparison of XY views of the capsid layer. Tomogram slices corresponding to the boxed area in Fig. 2 showing the progression in the reconstruction refinement as more tilt series (N = 1, 2, 3, 4, 5, 16) are included in the process, both with FBP and wSIRT. A p3 symmetry pattern of high density material in the capsid envelope (pointed by a red triangle in the bottom right image) becomes apparent, with a 14nm peak to peak distance
Fig. 4
Fig. 4
Mimivirus reconstruction obtained from different schemes. A Tomogram views (XY, YZ, and XZ) of a giant Mimivirus generated from the first tilt series (N = 1) and the whole set (N = 16), both with FBP and wSIRT. B Density profile of the various layers indicated by numbers along the blue line drawn in a as discussed in [13] obtained for each reconstruction case; 1 DNA core, 2 inner membrane, 3 outer membrane, 4 inner capsid shell, 5 outer capsid shell and 6 fibers
Fig. 5
Fig. 5
Assessment on the convergence process. We monitor the coefficient of variation cv on the middle tomogram slice as the number N of tilt series increases; cv is implemented both with FBP (red diamond points, left y-axis) and wSIRT (blue circular points, right y-axis). For the iterative approach, the total number of iterations is 50 with a mixing parameters α of 2; the original data were binned by 4
Fig. 6
Fig. 6
Tomogram views (XY, YZ, and XZ) of a 5-nm gold particle with respect to the number of tilt series N. A FBP is used. B wSIRT is used. While the image quality improves as N increases, the reconstruction still remain impaired by artifacts caused by the missing pyramid problem (equivalent to a missing cone problem when N). Note artifacts are attenuated for wSIRT (50 iterations and α=2) compared to FBP
Fig. 7
Fig. 7
Sample warping caused by the electron beam radiation can be simultaneously monitored and corrected for in the multiple tilt process. A The variations of n3,ω (green lines), defined in Eq. (10) and based on the linear portion of the computed projection maps, are a good indicator of the sample deformation happening over the course of the data acquisition. Its main behavior can be reproduced (doted blue lines) by considering a simple model having three deformation rates (γX, γY and γZ) allowing their estimates after an adjustment procedure. n3,ω oscillates between two curves as the many different tilt series (a, b,…, p) are successively acquired between −60° and +60°. The lower bound curve, reached at high tilt angles (|θ|=π/3), specifically depends on the sample compression along the normal axis, while the upper bound curve, reached at zero tilt, only depends on the lateral compressions. B Representation of the amount of compression along the three main sample directions versus the micrograph index. In the stationary region, the sample compression is estimated to be 2–4 % in the lateral directions and 15 % along the normal axis
Fig. 8
Fig. 8
Clathrin-coated vesicle reconstruction using a 16 tilt series scheme. A EM snapshot at zero tilt; gold markers (G) are indicated with arrows. B XY section in the middle of the reconstruction. Note the contrast increase between the projection in A and the tomogram slice. Free ribosomal units (R) are indicated with arrows. The diameter of this organelle inner vesicle averaged around 100 nm, making it significantly larger than previously reported similar structures [30]. C The number of triskelions should increase linearly with the vesicle surface; we counted 143 triskelions, which is consistent with the trend reported in [30]. Indeed, the square root of triskelions number versus inner vesicle diameter roughly follows a straight line.
Fig. 9
Fig. 9
Clathrin-coated vesicle reconstruction using different schemes. A XY tomogram slices containing a partial view of the clathrin cage obtained with different reconstruction schemes (FBP, N = 1, 2 and 16; wSIRT, N = 16). Note the free ribosomal units (R) around the cage. B, C An isosurface of a portion of the cage reconstruction (orange wireframe) is compared to the corresponding theoretical protein model assembly (solid gray surface). No extra matching transformation other than simple translations/rotations is necessary. D A segmentation of the clathrin cage is displayed on a wider scale showing a rough endoplasmic reticulum (ER) as well
Fig. 10
Fig. 10
Demonstration of the gold marker detection scheme outlined in "Appendix: Marker detection." This filtering procedure makes use of gaussian derivatives to calculate the second-order derivatives and allows to selectively enhance markers of a specific size (see recipe [21]). A A projection micrograph of the clathrin specimen at zero tilt is displayed. B The corresponding detector image is shown. The biological background behind the 5-nm gold markers is largely attenuated after applying this filter.
Fig. 11
Fig. 11
Flow chart describing the automation process for a single tilt series reconstruction. After detecting the marker projection peaks throughout the micrographs, 3D marker positions {Xτ}τ are inferred using a cluster analysis; this analysis is carried out on a set of 3D points located at the cross-over nodes of back-projected rays (Fig. 12). A trace ( set of matching peaks in a micrograph series) is then estimated for each marker, and the projection maps refined with a bundle adjustment procedure. This process is repeated iteratively to maximize the average trace size lττ
Fig. 12
Fig. 12
The 3D seeding procedure. A The gold markers are inferred as the main convergence nodes of back-projected rays arising from the detected projection peaks. B In practice, a cluster analysis is performed on the mid-points of the shortest segment joining selected pair of back-projected rays. Note that the two paths ω1 and ω2 do not necessarily cross in 3D
Fig. 13
Fig. 13
Flow chart summarizing the automation strategy for multiple tilt series. Each series i is first reconstructed independently as outlined in Fig. 11, generating multiple sets of gold marker 3D positions {Xii}τi. Their correspondences are established through an iterative process, allowing to identify the matching traces between tilt series. A global alignment is then implemented

References

    1. Shu, X., Lev-Ram, V., Deerinck, T.J., Qi, Y., Ramko, E.B., Davidson, M.W., Jin, Y., Ellisman, M.H., Tsien, R.Y.: A genetically encoded tag for correlated light and electron microscopy of intact cells, tissues, and organisms. PLoS Biol. 9(4), e1001041 (2011) - DOI - PMC - PubMed
    1. Martell, J.D., Deerinck, T.J., Sancak, Y., Poulos, T.L., Mootha, V.K., Sosinsky, G.E., Ellisman, M.H., Ting, A.Y.: Engineered ascorbate peroxidase as a genetically encoded reporter for electron microscopy. Nat. Biotechnol. 30, 1143–1148 (2012) - DOI - PMC - PubMed
    1. Ngo, J.T., Adams, S.R., Deerinck, T.J., Boassa, D., Rodriguez-Rivera, F., Palida, S.F., Bertozzi, C.R., Ellisman, M.H., Tsien, R.Y.: Click-EM for imaging metabolically tagged non-protein biomolecules. Nat. Chem. Biol. 12(6), 459–465 (2016). doi:10.1038/nchembio.2076 - DOI - PMC - PubMed
    1. Frank, J.: Electron Tomography: Methods for Three-Dimensional Visualization of Structure in the Cell. Springer, New York (2006)
    1. McEwen, B.F., Renken, C., Marko, M., Mannella, C.: Principles and Practice in Electron Tomography, pp. 129–168. Academic Press, San Diego (2008) - PubMed