

Force Sensitivity in Saccharomyces cerevisiae Flocculins
- PMID: 27547825
- PMCID: PMC4989244
- DOI: 10.1128/mSphere.00128-16
Force Sensitivity in Saccharomyces cerevisiae Flocculins
Abstract
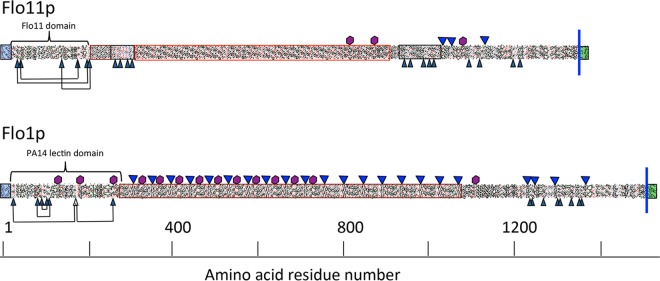
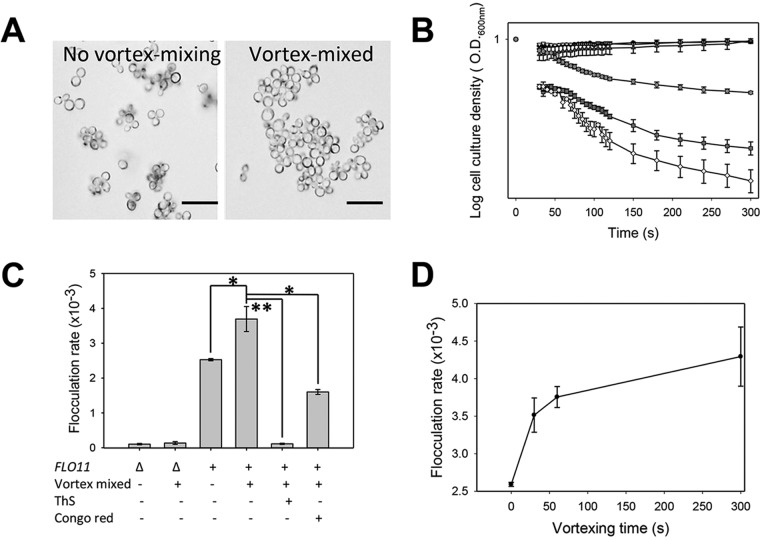
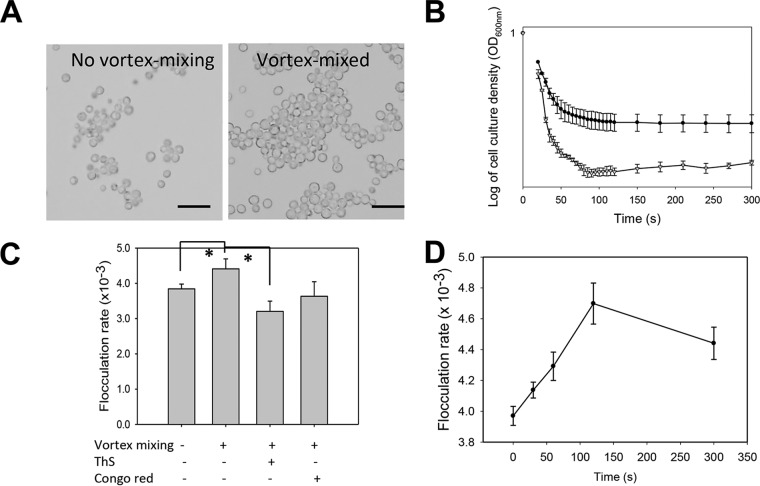
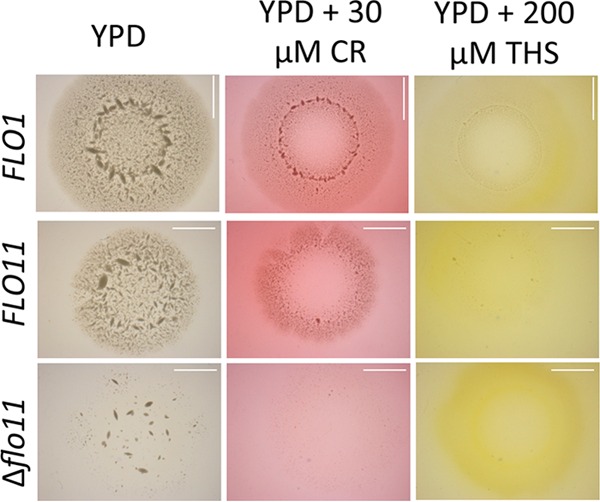
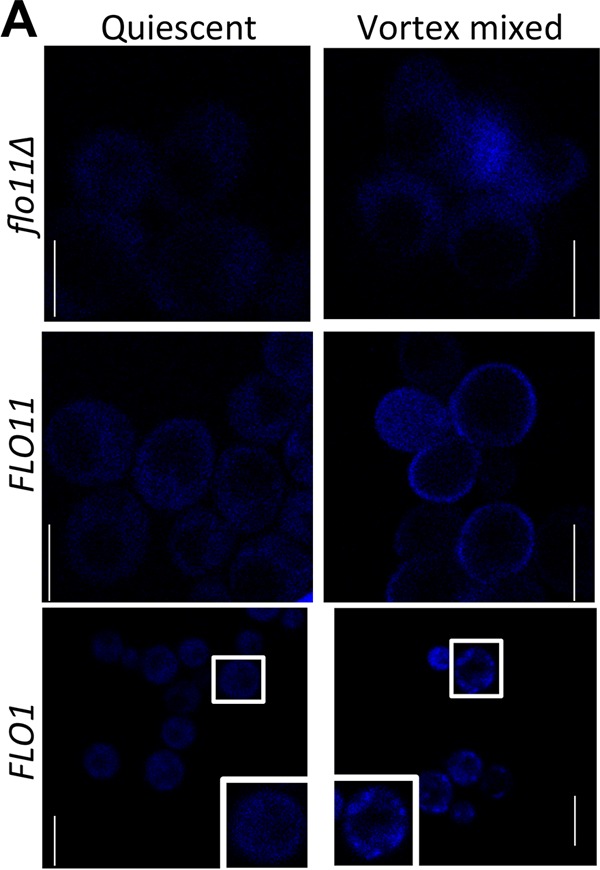
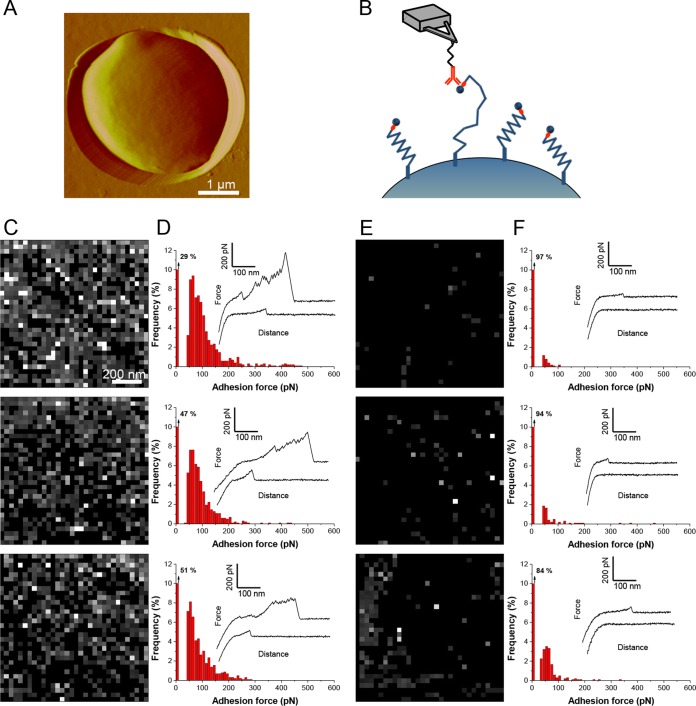
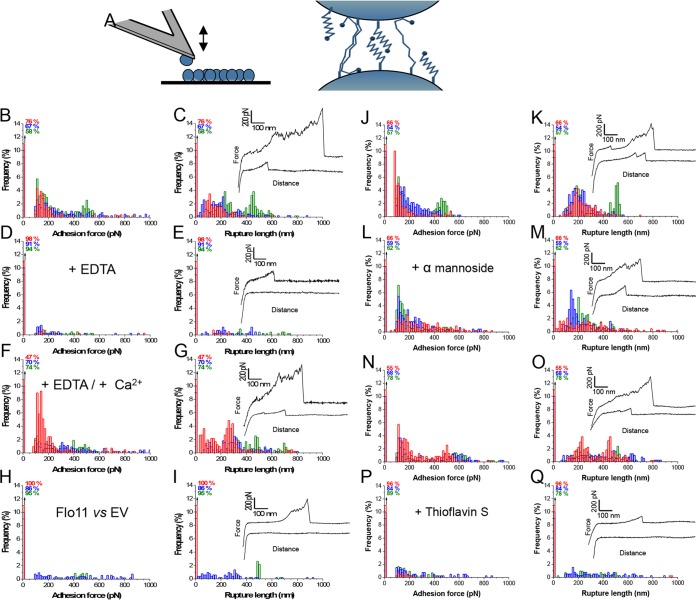
Many fungal adhesins have short, β-aggregation-prone sequences that play important functional roles, and in the Candida albicans adhesin Als5p, these sequences cluster the adhesins after exposure to shear force. Here, we report that Saccharomyces cerevisiae flocculins Flo11p and Flo1p have similar β-aggregation-prone sequences and are similarly stimulated by shear force, despite being nonhomologous. Shear from vortex mixing induced the formation of small flocs in cells expressing either adhesin. After the addition of Ca(2+), yeast cells from vortex-sheared populations showed greatly enhanced flocculation and displayed more pronounced thioflavin-bright surface nanodomains. At high concentrations, amyloidophilic dyes inhibited Flo1p- and Flo11p-mediated agar invasion and the shear-induced increase in flocculation. Consistent with these results, atomic force microscopy of Flo11p showed successive force-distance peaks characteristic of sequentially unfolding tandem repeat domains, like Flo1p and Als5p. Flo11p-expressing cells bound together through homophilic interactions with adhesion forces of up to 700 pN and rupture lengths of up to 600 nm. These results are consistent with the potentiation of yeast flocculation by shear-induced formation of high-avidity domains of clustered adhesins at the cell surface, similar to the activation of Candida albicans adhesin Als5p. Thus, yeast adhesins from three independent gene families use similar force-dependent interactions to drive cell adhesion. IMPORTANCE The Saccharomyces cerevisiae flocculins mediate the formation of cellular aggregates and biofilm-like mats, useful in clearing yeast from fermentations. An important property of fungal adhesion proteins, including flocculins, is the ability to form catch bonds, i.e., bonds that strengthen under tension. This strengthening is based, at least in part, on increased avidity of binding due to clustering of adhesins in cell surface nanodomains. This clustering depends on amyloid-like β-aggregation of short amino acid sequences in the adhesins. In Candida albicans adhesin Als5, shear stress from vortex mixing can unfold part of the protein to expose aggregation-prone sequences, and then adhesins aggregate into nanodomains. We therefore tested whether shear stress from mixing can increase flocculation activity by potentiating similar protein remodeling and aggregation in the flocculins. The results demonstrate the applicability of the Als adhesin model and provide a rational framework for the enhancement or inhibition of flocculation in industrial applications.
Keywords: biofilms; functional amyloid; fungal adhesins; glycoproteins.
Figures
Similar articles
-
A New Function for Amyloid-Like Interactions: Cross-Beta Aggregates of Adhesins form Cell-to-Cell Bonds.Pathogens. 2021 Aug 11;10(8):1013. doi: 10.3390/pathogens10081013. Pathogens. 2021. PMID: 34451476 Free PMC article. Review.
-
Role of force-sensitive amyloid-like interactions in fungal catch bonding and biofilms.Eukaryot Cell. 2014 Sep;13(9):1136-42. doi: 10.1128/EC.00068-14. Epub 2014 Mar 28. Eukaryot Cell. 2014. PMID: 24681687 Free PMC article.
-
The Human Disease-Associated Aβ Amyloid Core Sequence Forms Functional Amyloids in a Fungal Adhesin.mBio. 2016 Jan 12;7(1):e01815-15. doi: 10.1128/mBio.01815-15. mBio. 2016. PMID: 26758179 Free PMC article.
-
An Amyloid Core Sequence in the Major Candida albicans Adhesin Als1p Mediates Cell-Cell Adhesion.mBio. 2019 Oct 8;10(5):e01766-19. doi: 10.1128/mBio.01766-19. mBio. 2019. PMID: 31594814 Free PMC article.
-
Amyloid-Like β-Aggregates as Force-Sensitive Switches in Fungal Biofilms and Infections.Microbiol Mol Biol Rev. 2017 Nov 29;82(1):e00035-17. doi: 10.1128/MMBR.00035-17. Print 2018 Mar. Microbiol Mol Biol Rev. 2017. PMID: 29187516 Free PMC article. Review.
Cited by
-
Functional Amyloids.Cold Spring Harb Perspect Biol. 2019 Dec 2;11(12):a033860. doi: 10.1101/cshperspect.a033860. Cold Spring Harb Perspect Biol. 2019. PMID: 31088827 Free PMC article. Review.
-
Serum Amyloid P Component Binds Fungal Surface Amyloid and Decreases Human Macrophage Phagocytosis and Secretion of Inflammatory Cytokines.mBio. 2019 Mar 12;10(2):e00218-19. doi: 10.1128/mBio.00218-19. mBio. 2019. PMID: 30862745 Free PMC article.
-
Sticking to the Subject: Multifunctionality in Microbial Adhesins.J Fungi (Basel). 2023 Mar 29;9(4):419. doi: 10.3390/jof9040419. J Fungi (Basel). 2023. PMID: 37108873 Free PMC article. Review.
-
Microbial adhesion and ultrastructure from the single-molecule to the single-cell levels by Atomic Force Microscopy.Cell Surf. 2019 Aug 30;5:100031. doi: 10.1016/j.tcsw.2019.100031. eCollection 2019 Dec. Cell Surf. 2019. PMID: 32743147 Free PMC article. Review.
-
A New Function for Amyloid-Like Interactions: Cross-Beta Aggregates of Adhesins form Cell-to-Cell Bonds.Pathogens. 2021 Aug 11;10(8):1013. doi: 10.3390/pathogens10081013. Pathogens. 2021. PMID: 34451476 Free PMC article. Review.
References
-
- Smukalla S, Caldara M, Pochet N, Beauvais A, Guadagnini S, Yan C, Vinces MD, Jansen A, Prevost MC, Latgé JP, Fink GR, Foster KR, Verstrepen KJ. 2008. FLO1 is a variable green beard gene that drives biofilm-like cooperation in budding yeast. Cell 135:726–737. doi:10.1016/j.cell.2008.09.037. - DOI - PMC - PubMed
Grants and funding
LinkOut - more resources
Full Text Sources
Other Literature Sources
Molecular Biology Databases
Miscellaneous
