. 2016 Oct 21;11(10):2854-2864.
doi: 10.1021/acschembio.6b00453. Epub 2016 Sep 1.

Dual Readout BRET/FRET Sensors for Measuring Intracellular Zinc

Affiliations

Dual Readout BRET/FRET Sensors for Measuring Intracellular Zinc

Stijn J A Aper et al. ACS Chem Biol. .

Abstract

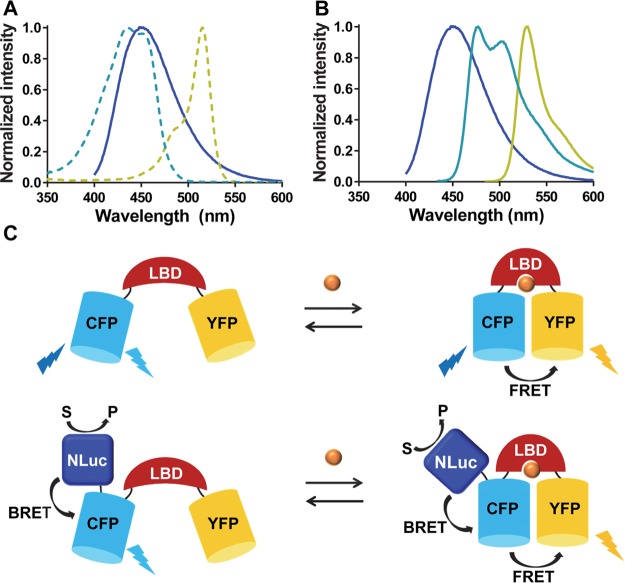
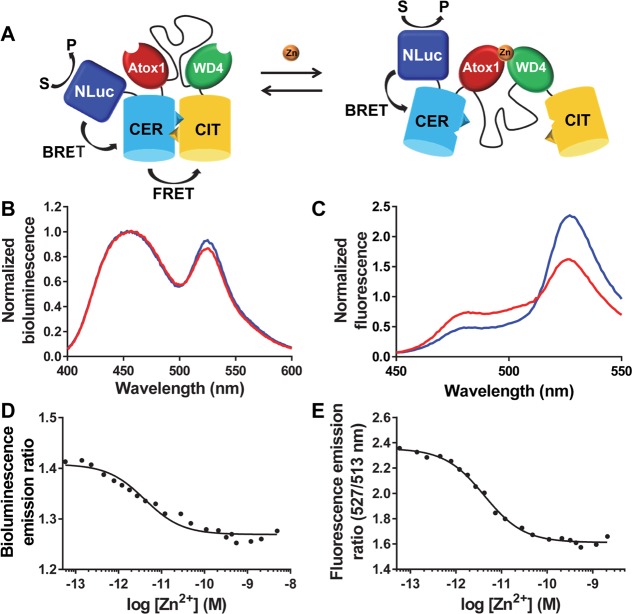
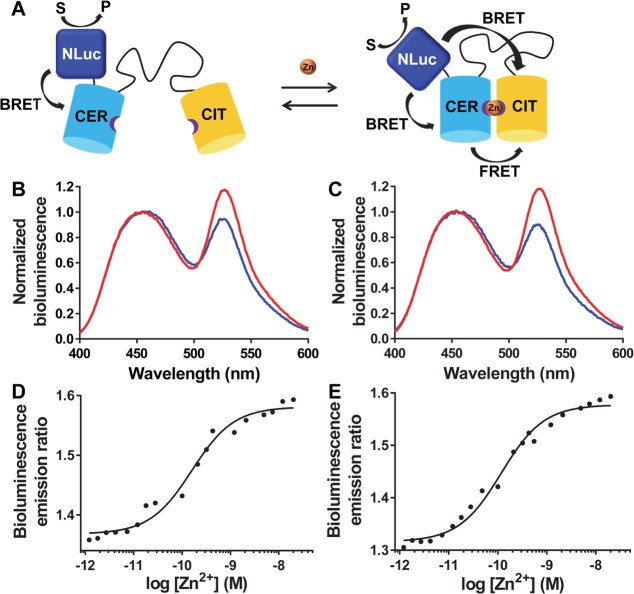
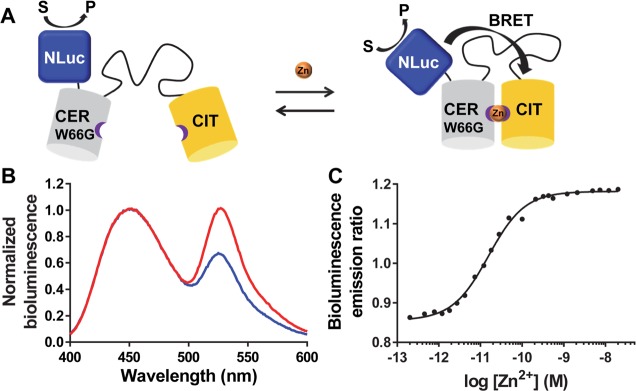
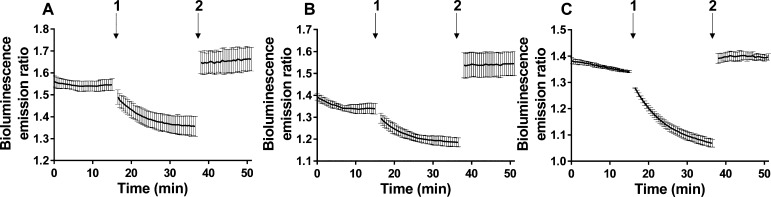
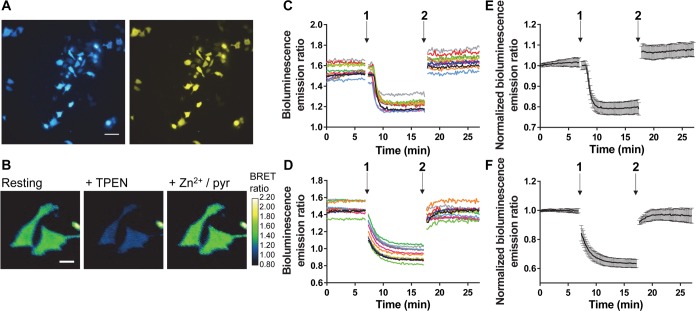
Genetically encoded FRET-based sensor proteins have significantly contributed to our current understanding of the intracellular functions of Zn2+. However, the external excitation required for these fluorescent sensors can give rise to photobleaching and phototoxicity during long-term imaging, limits applications that suffer from autofluorescence and light scattering, and is not compatible with light-sensitive cells. For these applications, sensor proteins based on Bioluminescence Resonance Energy Transfer (BRET) would provide an attractive alternative. In this work, we used the bright and stable luciferase NanoLuc to create the first genetically encoded BRET sensors for measuring intracellular Zn2+. Using a new sensor approach, the NanoLuc domain was fused to the Cerulean donor domain of two previously developed FRET sensors, eCALWY and eZinCh-2. In addition to preserving the excellent Zn2+ affinity and specificity of their predecessors, these newly developed sensors enable both BRET- and FRET-based detection. While the dynamic range of the BRET signal for the eCALWY-based BLCALWY-1 sensor was limited by the presence of two competing BRET pathways, BRET/FRET sensors based on the eZinCh-2 scaffold (BLZinCh-1 and -2) yielded robust 25-30% changes in BRET ratio. In addition, introduction of a chromophore-silencing mutation resulted in a BRET-only sensor (BLZinCh-3) with increased BRET response (50%) and an unexpected 10-fold increase in Zn2+ affinity. The combination of robust ratiometric response, physiologically relevant Zn2+ affinities, and stable and bright luminescence signal offered by the BLZinCh sensors allowed monitoring of intracellular Zn2+ in plate-based assays as well as intracellular BRET-based imaging in single living cells in real time.


Conflict of interest statement

The authors declare no competing financial interest.

Figures

Figure 1
Figure 1
(A) Emission spectrum of NLuc (dark blue) displayed together with the excitation spectra of Cerulean (dashed light blue) and Citrine (dashed yellow). (B) Overlap of emission spectrum of NLuc (dark blue) with the emission spectra of Cerulean (light blue) and Citrine (yellow). (C) Sensor mechanisms of FRET sensor (top) and BRET/FRET sensor (bottom). The binding of the ligand to its binding domain (LBD) induces a change of FRET between CFP and YFP. Upon fusion of NLuc to the FRET sensor, bioluminescence readout is introduced while the ligand reporting properties of the sensor remain unchanged.
Figure 2
Figure 2
(A) Sensor mechanism of the BLCALWY-1 sensor (CER = Cerulean, CIT = Citrine). (B,C) Bioluminescence (B; normalized to emission at 455 nm) and fluorescence (C; normalized to emission at 513 nm) emission spectra of BLCALWY-1 in Zn2+-depleted (blue) and Zn2+-saturated states (red). Measurements were performed using 0.5 nM BLCALWY-1 and 3000-fold diluted furimazine (B) or 50 nM BLCALWY-1 (C) in 150 mM HEPES (pH 7.1); 100 mM NaCl, 10% (v/v) glycerol, 5 μM DTT, 1 mM TCEP, and 1 mg mL–1 BSA, at 20 °C (B) or 25 °C (C). (D,E) Bioluminescence emission ratio (emission 500–545 nm/emission 400–455 nm; D) and fluorescence emission ratio (527/513 nm; E) of BLCALWY-1, in the presence of a range of free Zn2+ concentrations buffered using 1 mM EDTA, 1 mM HEDTA, 1 mM DHPTA, 5 mM EGTA, or 1 mM EGTA. Measurements were performed using 0.2 nM BLCALWY-1 and 3200-fold diluted furimazine (D) or 50 nM BLCALWY-1 (E) in 150 mM HEPES (pH 7.1), 100 mM NaCl, 10% (v/v) glycerol, 5 μM DTT, 1 mM TCEP, and 1 mg mL–1 BSA, at 23–25 °C. Data points represent the average of two measurements, and the solid lines are fits using eq 1, from which Kd’s of 4.1 ± 0.9 pM (D) and 4.2 ± 0.3 pM (E) were determined, respectively.
Figure 3
Figure 3
(A) Sensor mechanism of BLZinCh-1 and BLZinCh-2 (CER = Cerulean, CIT = Citrine). (B,C) Bioluminescence emission spectra (normalized to emission at 455 nm) of BLZinCh-1 (B) and BLZinCh-2 (C) in Zn2+-depleted (blue) and Zn2+-saturated state (red). Measurements were performed using 0.5 nM protein and 3000-fold diluted furimazine in 150 mM HEPES (pH 7.1), 100 mM NaCl, 10% (v/v) glycerol, 5 μM DTT, 1 mM TCEP, and 1 mg mL–1 BSA, at 20 °C. (D,E) Bioluminescence emission ratio (emission 500–545 nm/emission 400–455 nm) of BLZinCh-1 (D) and BLZinCh-2 (E), in the presence of a range of free Zn2+ concentrations buffered using 1 mM HEDTA, 1 mM DHPTA, 5 mM EGTA, or 1 mM EGTA. Measurements were performed using 0.2 nM protein and 3200-fold diluted furimazine in 150 mM HEPES (pH 7.1), 100 mM NaCl, 10% (v/v) glycerol, 5 μM DTT, 1 mM TCEP, and 1 mg mL–1 BSA, at 23–25 °C. Data points represent the average of two measurements, and the solid lines are fits assuming single binding events using eq 1, from which Kd’s of 160 ± 29 pM (D) and 117 ± 16 pM (E) were determined, respectively.
Figure 4
Figure 4
(A) Sensor mechanism of BLZinCh-3 (CER = Cerulean, CIT = Citrine). (B) Bioluminescence emission spectra (normalized to emission at 455 nm) of BLZinCh-3 in Zn2+-depleted (blue) and Zn2+-saturated state (red). The measurement was performed using 0.1 nM protein and 3000-fold diluted furimazine in 150 mM HEPES (pH 7.1), 100 mM NaCl, 10% (v/v) glycerol, 5 μM DTT, 1 mM TCEP, and 1 mg mL–1 BSA, at 20 °C. (C) Bioluminescence emission ratio (emission 500–545 nm/emission 400–455 nm) of BLZinCh-3 in the presence of a range of free Zn2+ concentrations buffered using 1 mM HEDTA, 1 mM DHPTA, 5 mM EGTA, or 1 mM EGTA. Measurements were performed using 0.2 nM protein and 3200-fold diluted furimazine in 150 mM HEPES (pH 7.1), 100 mM NaCl, 10% (v/v) glycerol, 5 μM DTT, 1 mM TCEP, and 1 mg mL–1 BSA, at 23 °C. Data points represent the average of two measurements, and the solid line depicts a fit of the data assuming a single binding event using eq 1, from which the Kd of 15.6 ± 1.0 pM was determined.
Figure 5
Figure 5
Bioluminescence emission ratio (emission 500–545 nm/emission 400–455 nm) of HeLa cells expressing BLZinCh-1 (A), BLZinCh-2 (B), and BLZinCh-3 (C) in a resting state and after subsequent addition of 50 μM TPEN (1) and 100 μM Zn2+/5 μM pyrithione (2). Bioluminescence of a suspension of HeLa cells was measured on a plate reader using 3000-fold diluted furimazine in 20 mM HEPES (pH 7.4), 140 mM NaCl, 2.5 mM KCl, 1.8 mM CaCl2, and 1.0 mM MgCl2, at 37 °C. Measurements were stopped for ∼1 min during the additions at time points 1 and 2. All traces represent the average of four measurements. Error bars represent standard deviation (SD).
Figure 6
Figure 6
(A) Bioluminescence images of NLuc-Cerulean emission (left; 420–460 nm) and Citrine emission (right; 510–550 nm) of HeLa cells expressing the BLZinCh-1 sensor. Scale bar = 80 μm. (B) False-colored ratiometric images of two HeLa cells expressing BLZinCh-1, in resting state and after additions of 50 μM TPEN and 100 μM Zn2+/5 μM pyrithione. Scale bar = 20 μm. (C,D) Bioluminescence emission ratio traces of 12 cells expressing BLZinCh-1 (C) or BLZinCh-3 (D), in a resting state and after additions of 50 μM TPEN (1) and 100 μM Zn2+/5 μM pyrithione (2). (E,F) Average bioluminescence emission ratio of the data shown in C and D, respectively, after normalization of the emission ratio at t = 0 min. Experiments were done using 500-fold diluted furimazine in live-cell imaging buffer (20 mM HEPES (pH 7.4), 140 mM NaCl, 2.5 mM KCl, 1.8 mM CaCl2, and 1.0 mM MgCl2), at 37 °C and 5% CO2. Imaging was stopped for ∼1 min during the additions at time points 1 and 2. Error bars represent SD.

Similar articles

Cited by

References

    1. Fukada T.; Yamasaki S.; Nishida K.; Murakami M.; Hirano T. (2011) Zinc homeostasis and signaling in health and diseases: Zinc signaling. JBIC, J. Biol. Inorg. Chem. 16, 1123–1134. 10.1007/s00775-011-0797-4. - DOI - PMC - PubMed
    1. Vallee B. L.; Falchuk K. H. (1993) The biochemical basis of zinc physiology. Physiol Rev. 73, 79–118. - PubMed
    1. Maret W. (2009) Molecular aspects of human cellular zinc homeostasis: redox control of zinc potentials and zinc signals. BioMetals 22, 149–157. 10.1007/s10534-008-9186-z. - DOI - PubMed
    1. Fukada T.; Hojyo S.; Furuichi T. (2013) Zinc signal: a new player in osteobiology. J. Bone Miner. Metab. 31, 129–135. 10.1007/s00774-012-0409-6. - DOI - PubMed
    1. Hessels A. M.; Taylor K. M.; Merkx M. (2016) Monitoring cytosolic and ER Zn2+ in stimulated breast cancer cells using genetically encoded FRET sensors. Metallomics 8, 211–217. 10.1039/C5MT00257E. - DOI - PMC - PubMed

Publication types