

The impact of pyrethroid resistance on the efficacy and effectiveness of bednets for malaria control in Africa
- PMID: 27547988
- PMCID: PMC5025277
- DOI: 10.7554/eLife.16090
The impact of pyrethroid resistance on the efficacy and effectiveness of bednets for malaria control in Africa
Abstract
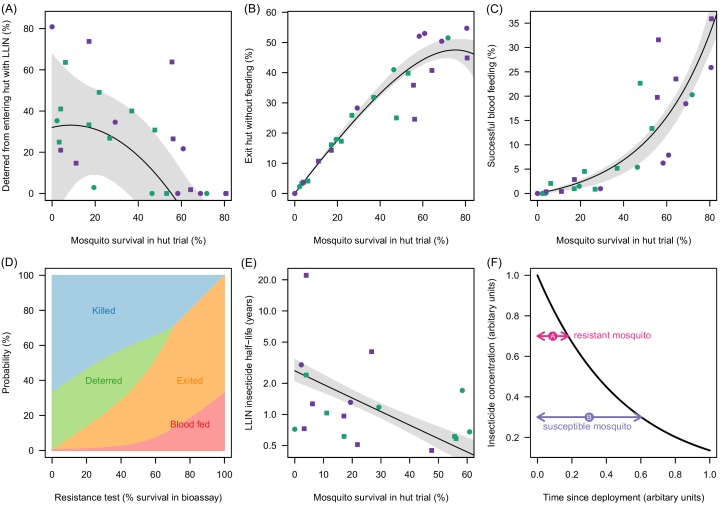
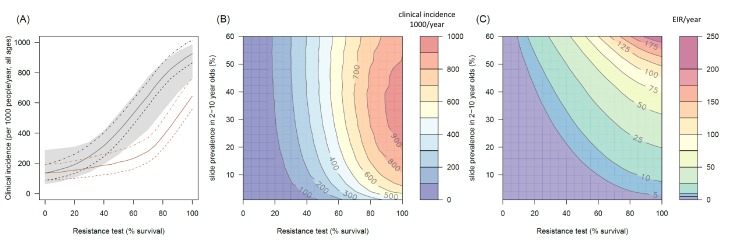
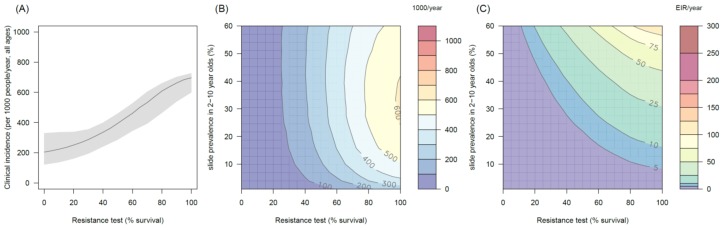
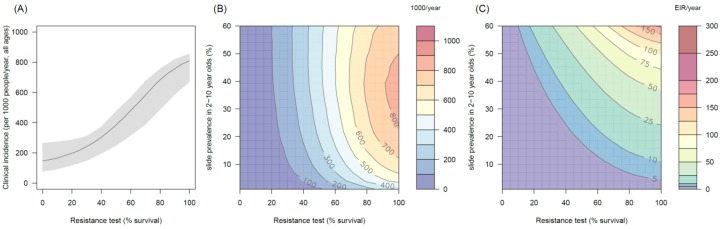
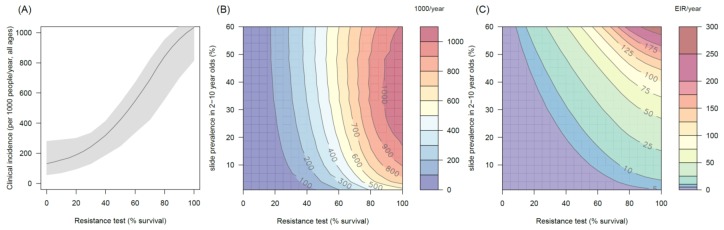
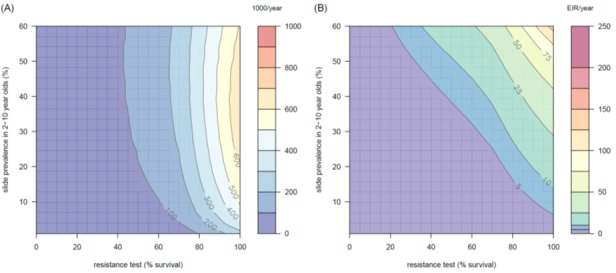
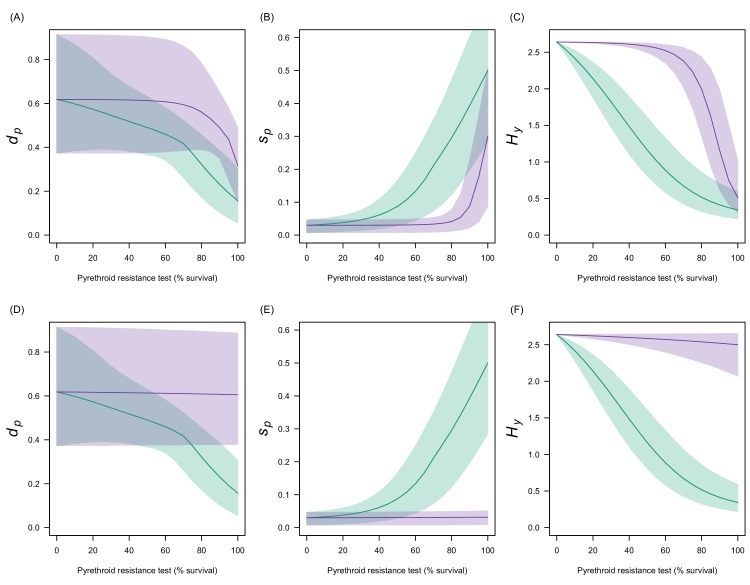
Long lasting pyrethroid treated bednets are the most important tool for preventing malaria. Pyrethroid resistant Anopheline mosquitoes are now ubiquitous in Africa, though the public health impact remains unclear, impeding the deployment of more expensive nets. Meta-analyses of bioassay studies and experimental hut trials are used to characterise how pyrethroid resistance changes the efficacy of standard bednets, and those containing the synergist piperonyl butoxide (PBO), and assess its impact on malaria control. New bednets provide substantial personal protection until high levels of resistance, though protection may wane faster against more resistant mosquito populations as nets age. Transmission dynamics models indicate that even low levels of resistance would increase the incidence of malaria due to reduced mosquito mortality and lower overall community protection over the life-time of the net. Switching to PBO bednets could avert up to 0.5 clinical cases per person per year in some resistance scenarios.
Keywords: P. falciparum; bednets; epidemiology; global health; malaria; mosquito; pyrethroid resistance.
Conflict of interest statement
The authors declare that no competing interests exist.
Figures
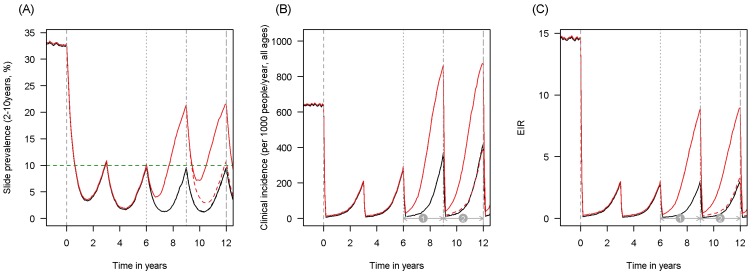
 ). Similarly, the impact of switching to PBO LLINs (in Figure 5) is estimated by averaging the clinical incidence and EIR for the solid red line (standard LLINs) and dashed red lines (switch to PBO LLINs) lines between the years 9 and 12 (period
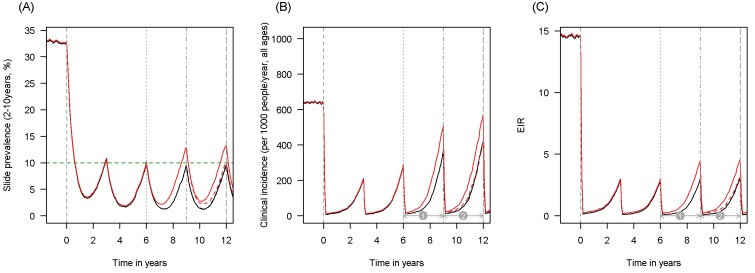
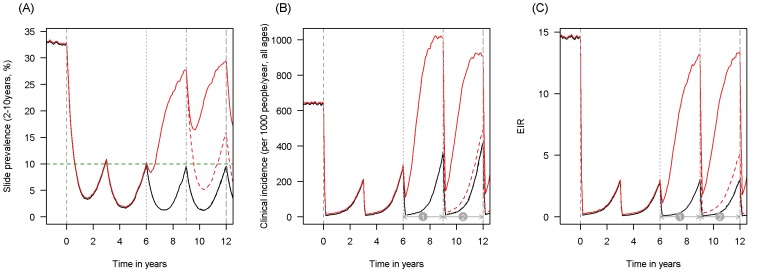
  ). Different scenarios with a low and high prevalence of pyrethroid resistance are shown in Figure 1—figure supplements 1 and 2. DOI:
 ). Similarly, the impact of switching to PBO LLINs (in Figure 5) is estimated by averaging the clinical incidence and EIR for the solid red line (standard LLINs) and dashed red lines (switch to PBO LLINs) lines between years 9 and 12 (period
  ). DOI:
 ). Similarly, the impact of switching to PBO LLINs (in Figure 5) is estimated by averaging the clinical incidence and EIR for the solid red line (standard LLINs) and dashed red lines (switch to PBO LLINs) lines between years 9 and 12 (period
  ). DOI:

References
-
- Adeogun AO, Olojede JB, Oduola AO, Awolola TS. Village-scale evaluation of PermaNet 3.0: an enhanced efficacy combination long-lasting insecticidal net against resistant populations of Anopheles gambiae s.s. Malaria Chemotherapy, Control and Elimination. 2012b;1:1–9. doi: 10.4303/mcce/235543. - DOI
-
- Adeogun AOO, Olojede JB, Oduola AO, Awolola TS. Efficacy of a combination long lasting insecticidal net (PermaNet® 3.0) against pyrethroid resistant Anopheles gambiae s.s. and Culex quinquefasciatus: an experimental hut trial in Nigeria. Nigerian Journal of Clinical & Biomedical Research. 2012a;6:37–50.
-
- Agossa FR, Padonou GG, Gnanguenon V, Oké-Agbo F, Zola-Sahossi J, Dègnonvi H, Salako A, Sèzonlin M, Akogbéto MC. Laboratory and field evaluation of the impact of washings on the effectiveness of LifeNet®, Olyset® and PermaNet® 2.0 in two areas, where there is a high level of resistance of Anopheles gambiae to pyrethroids, Benin, West Africa. Malaria Journal. 2014;13:e16090. doi: 10.1186/1475-2875-13-193. - DOI - PMC - PubMed
-
- Asale A, Getachew Y, Hailesilassie W, Speybroeck N, Duchateau L, Yewhalaw D. Evaluation of the efficacy of DDT indoor residual spraying and long-lasting insecticidal nets against insecticide resistant populations of Anopheles arabiensis Patton (Diptera: Culicidae) from Ethiopia using experimental huts. Parasites & Vectors. 2014;7:e16090. doi: 10.1186/1756-3305-7-131. - DOI - PMC - PubMed
Publication types
MeSH terms
Substances
Grants and funding
LinkOut - more resources
Full Text Sources
Other Literature Sources
Medical
