A Simple Luminescent Adenylate-Cyclase Functional Assay for Evaluation of Bacillus anthracis Edema Factor Activity
- PMID: 27548219
- PMCID: PMC4999859
- DOI: 10.3390/toxins8080243
A Simple Luminescent Adenylate-Cyclase Functional Assay for Evaluation of Bacillus anthracis Edema Factor Activity
Abstract
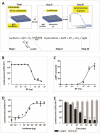
Edema Factor (EF), the toxic sub-unit of the Bacillus anthracis Edema Toxin (ET) is a calmodulin-dependent adenylate cyclase whose detrimental activity in the infected host results in severe edema. EF is therefore a major virulence factor of B. anthracis. We describe a simple, rapid and reliable functional adenylate-cyclase assay based on inhibition of a luciferase-mediated luminescence reaction. The assay exploits the efficient adenylate cyclase-mediated depletion of adenosine tri-phosphate (ATP), and the strict dependence on ATP of the light-emitting luciferase-catalyzed luciferin-conversion to oxyluciferin, which can be easily visualized. The assay exhibits a robust EF-dose response decrease in luminescence, which may be specifically reverted by anti-EF antibodies. The application of the assay is exemplified in: (a) determining the presence of EF in B. anthracis cultures, or its absence in cultures of EF-defective strains; (b) evaluating the anti-EF humoral response in experimental animals infected/vaccinated with B. anthracis; and (c) rapid discrimination between EF producing and non-producing bacterial colonies. Furthermore, the assay may be amenable with high-throughput screening for EF inhibitory molecules.
Keywords: ATP-depletion; Bacillus anthracis; Edema Factor; adenylate cyclase; luciferase; luminescent assay.
Figures


Similar articles
-
Anthrax edema factor toxicity is strongly mediated by the N-end rule.PLoS One. 2013 Aug 28;8(8):e74474. doi: 10.1371/journal.pone.0074474. eCollection 2013. PLoS One. 2013. PMID: 24015319 Free PMC article.
-
Distinct interactions of 2'- and 3'-O-(N-methyl)anthraniloyl-isomers of ATP and GTP with the adenylyl cyclase toxin of Bacillus anthracis, edema factor.Biochem Pharmacol. 2009 Aug 1;78(3):224-30. doi: 10.1016/j.bcp.2009.04.006. Biochem Pharmacol. 2009. PMID: 19492438 Free PMC article.
-
Inhibition of the adenylyl cyclase toxin, edema factor, from Bacillus anthracis by a series of 18 mono- and bis-(M)ANT-substituted nucleoside 5'-triphosphates.Naunyn Schmiedebergs Arch Pharmacol. 2012 Jan;385(1):57-68. doi: 10.1007/s00210-011-0688-9. Epub 2011 Sep 24. Naunyn Schmiedebergs Arch Pharmacol. 2012. PMID: 21947230
-
Bacillus anthracis edema factor substrate specificity: evidence for new modes of action.Toxins (Basel). 2012 Jul;4(7):505-35. doi: 10.3390/toxins4070505. Epub 2012 Jul 6. Toxins (Basel). 2012. PMID: 22852066 Free PMC article. Review.
-
The adenylyl cyclase activity of anthrax edema factor.Mol Aspects Med. 2009 Dec;30(6):423-30. doi: 10.1016/j.mam.2009.06.001. Epub 2009 Jun 26. Mol Aspects Med. 2009. PMID: 19560485 Free PMC article. Review.
Cited by
-
A Robust and Sensitive Spectrophotometric Assay for the Enzymatic Activity of Bacterial Adenylate Cyclase Toxins.Toxins (Basel). 2022 Oct 8;14(10):691. doi: 10.3390/toxins14100691. Toxins (Basel). 2022. PMID: 36287960 Free PMC article.
-
Distinct Contribution of the HtrA Protease and PDZ Domains to Its Function in Stress Resilience and Virulence of Bacillus anthracis.Front Microbiol. 2019 Feb 18;10:255. doi: 10.3389/fmicb.2019.00255. eCollection 2019. Front Microbiol. 2019. PMID: 30833938 Free PMC article.
-
Detection and Identification of Bacillus anthracis: From Conventional to Molecular Microbiology Methods.Microorganisms. 2020 Jan 16;8(1):125. doi: 10.3390/microorganisms8010125. Microorganisms. 2020. PMID: 31963339 Free PMC article. Review.
-
Anthrax Toxin Detection: From in Vivo Studies to Diagnostic Applications.Microorganisms. 2020 Jul 23;8(8):1103. doi: 10.3390/microorganisms8081103. Microorganisms. 2020. PMID: 32717946 Free PMC article. Review.
-
Emergent Biosensing Technologies Based on Fluorescence Spectroscopy and Surface Plasmon Resonance.Sensors (Basel). 2021 Jan 29;21(3):906. doi: 10.3390/s21030906. Sensors (Basel). 2021. PMID: 33572812 Free PMC article. Review.
References
-
- Blendon R.J., Benson J.M., DesRoches C.M., Pollard W.E., Parvanta C., Herrmann M.J. The impact of anthrax attacks on the American public. MedGenMed. 2002;4:1. - PubMed
-
- Friedlander A.M., Welkos S.L., Ivins B.E. Anthrax vaccines. In: Koehler T., editor. Anthrax. Volume 271. Springer; Berlin/Heidelberg, Germany: 2002. pp. 33–60. - PubMed
-
- Leppla S.H. Anthrax toxins. In: Moss J., Iglewski B., Vaughan M., Tu A.T., editors. Bacterial Toxins and Virulence Factors in Disease. Marcel Dekker; New York, NY, USA: 1995. pp. 543–572.
Publication types
MeSH terms
Substances
LinkOut - more resources
Full Text Sources
Other Literature Sources

