. 2016 Aug 22;12(8):e1006222.
doi: 10.1371/journal.pgen.1006222. eCollection 2016 Aug.

KdmB, a Jumonji Histone H3 Demethylase, Regulates Genome-Wide H3K4 Trimethylation and Is Required for Normal Induction of Secondary Metabolism in Aspergillus nidulans

Affiliations

KdmB, a Jumonji Histone H3 Demethylase, Regulates Genome-Wide H3K4 Trimethylation and Is Required for Normal Induction of Secondary Metabolism in Aspergillus nidulans

Agnieszka Gacek-Matthews et al. PLoS Genet. .

Abstract

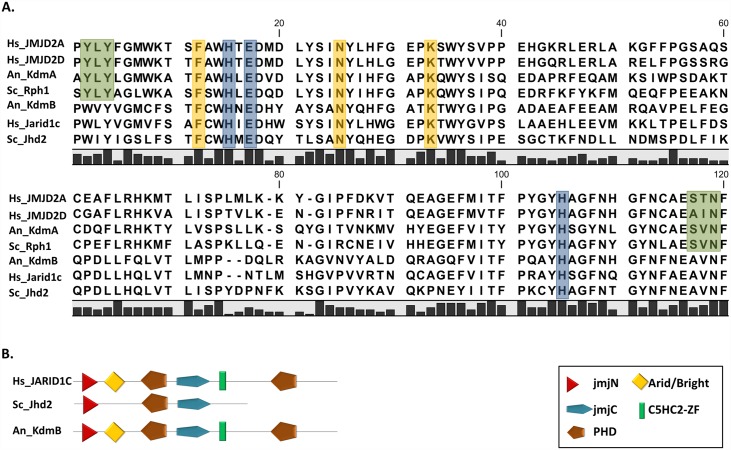
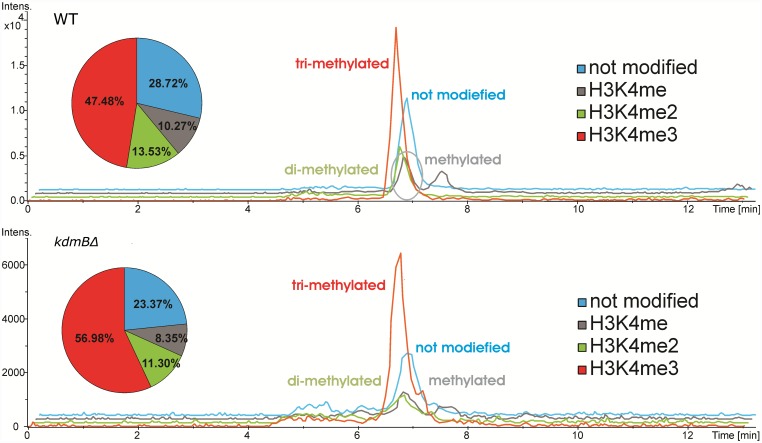
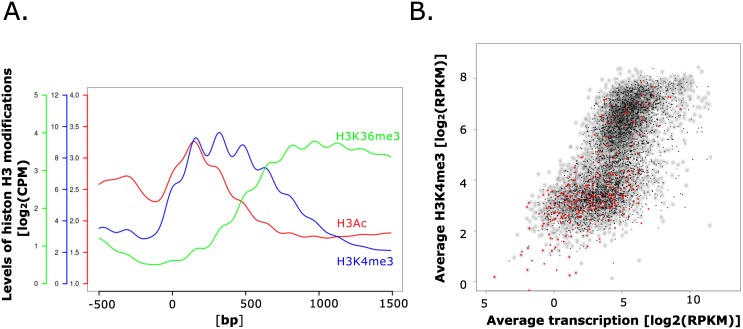
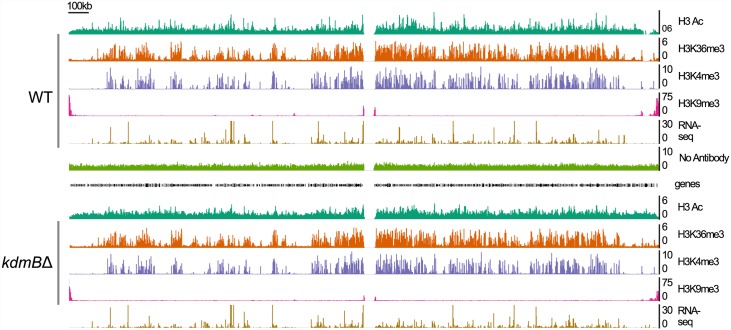
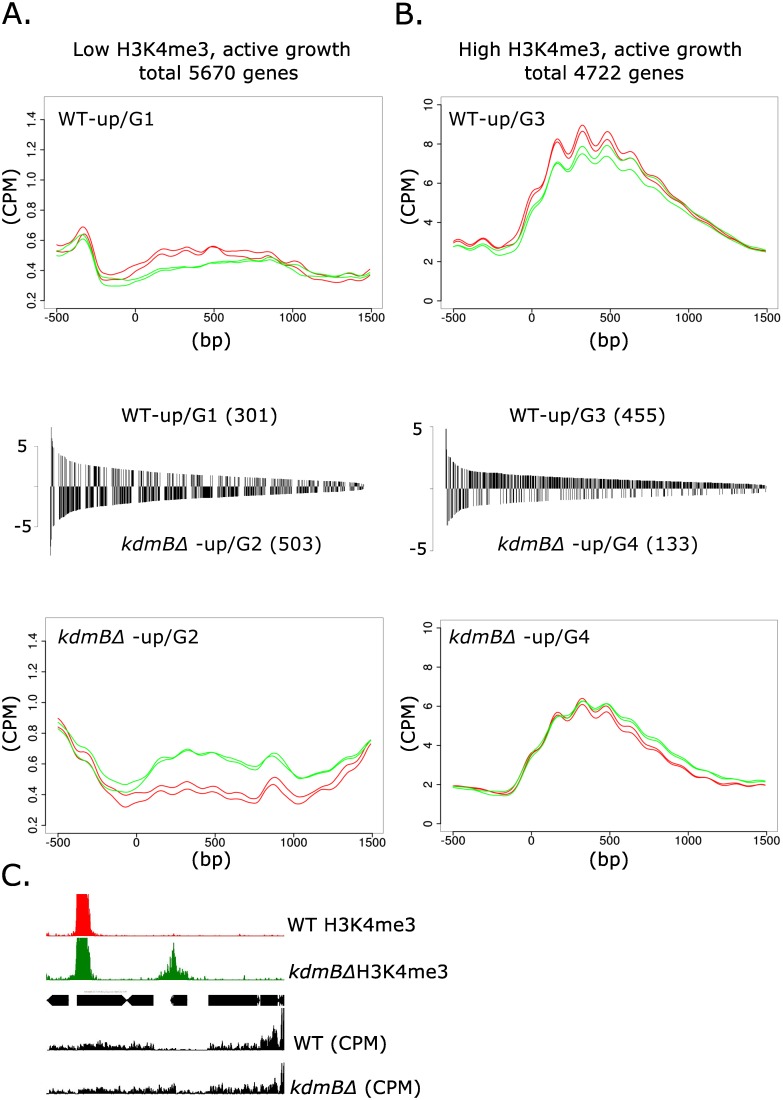
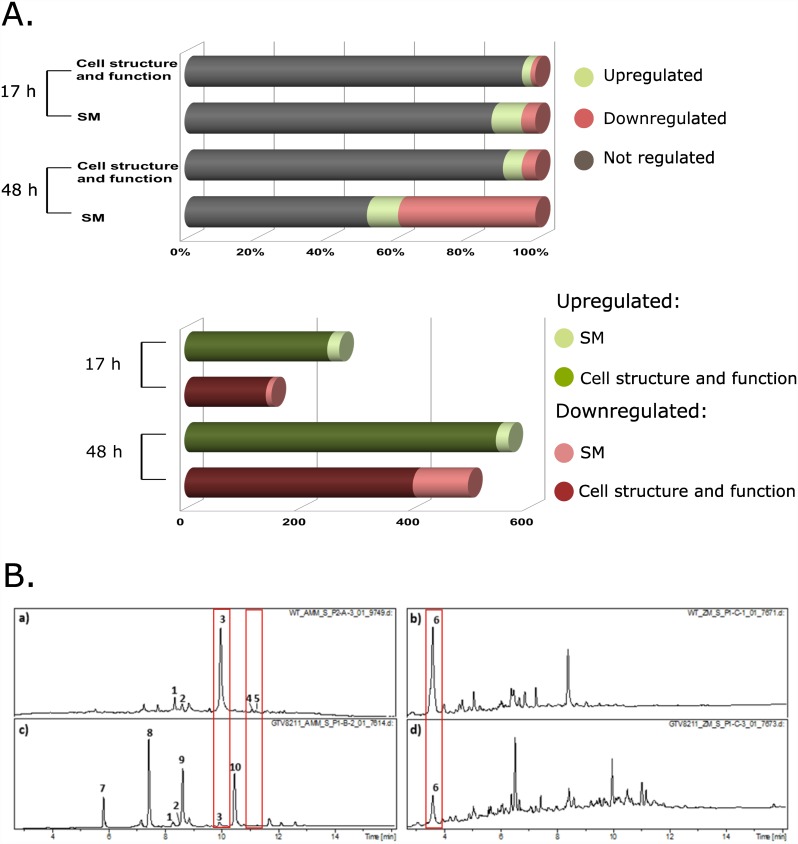
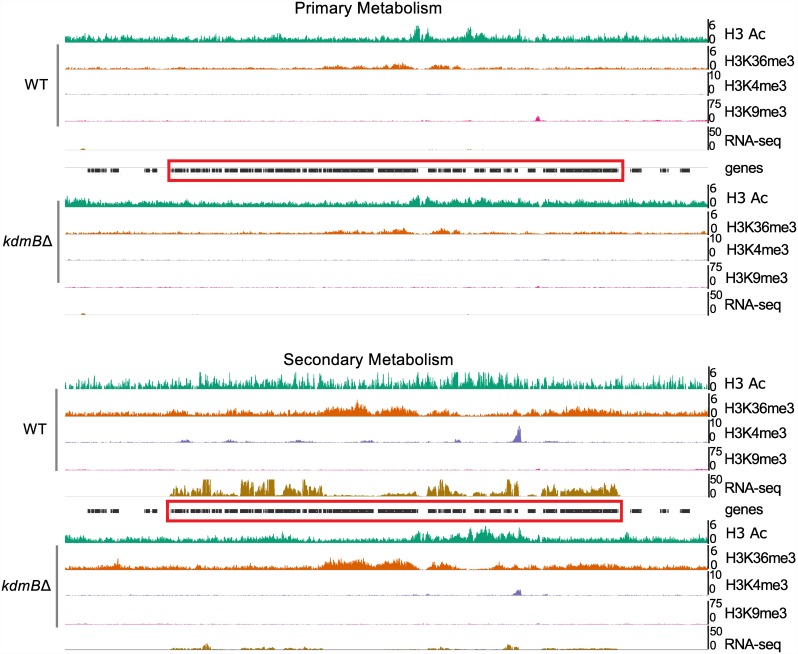
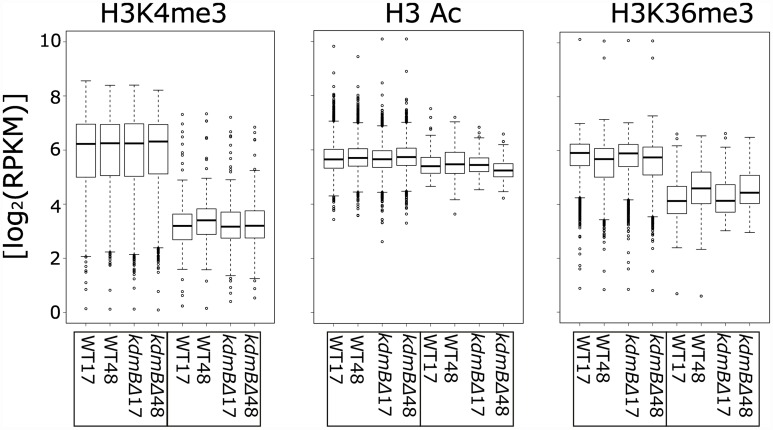
Histone posttranslational modifications (HPTMs) are involved in chromatin-based regulation of fungal secondary metabolite biosynthesis (SMB) in which the corresponding genes-usually physically linked in co-regulated clusters-are silenced under optimal physiological conditions (nutrient-rich) but are activated when nutrients are limiting. The exact molecular mechanisms by which HPTMs influence silencing and activation, however, are still to be better understood. Here we show by a combined approach of quantitative mass spectrometry (LC-MS/MS), genome-wide chromatin immunoprecipitation (ChIP-seq) and transcriptional network analysis (RNA-seq) that the core regions of silent A. nidulans SM clusters generally carry low levels of all tested chromatin modifications and that heterochromatic marks flank most of these SM clusters. During secondary metabolism, histone marks typically associated with transcriptional activity such as H3 trimethylated at lysine-4 (H3K4me3) are established in some, but not all gene clusters even upon full activation. KdmB, a Jarid1-family histone H3 lysine demethylase predicted to comprise a BRIGHT domain, a zinc-finger and two PHD domains in addition to the catalytic Jumonji domain, targets and demethylates H3K4me3 in vivo and mediates transcriptional downregulation. Deletion of kdmB leads to increased transcription of about ~1750 genes across nutrient-rich (primary metabolism) and nutrient-limiting (secondary metabolism) conditions. Unexpectedly, an equally high number of genes exhibited reduced expression in the kdmB deletion strain and notably, this group was significantly enriched for genes with known or predicted functions in secondary metabolite biosynthesis. Taken together, this study extends our general knowledge about multi-domain KDM5 histone demethylases and provides new details on the chromatin-level regulation of fungal secondary metabolite production.


Conflict of interest statement

The authors have declared that no competing interests exist.

Figures

Fig 1
Fig 1. The catalytic domain of JMJD2 and JARID- JmjC family demethylases.
A. Sequence alignment of JmjC domains of JMJD2 and JARID demethylases from human (Hs), A. nidulans (An) and S. cerevisiae (Sc). Conserved residues responsible for the catalytic activity are marked in yellow (α-ketoglutarate binding site) and blue (Fe2+ binding site). Specificity-determining residues for H3K9K36me2/3 are marked in green [61, 62]. B. Domain composition of JARID group H3K4me2/3 demethylases from human, A. nidulans and S. cerevisiae. KdmB possesses conserved histidine and glutamate as well as phenylalanine, asparagine and lysine residues responsible for Fe2+ ion chelating and α-ketoglutarate binding respectively, which are found in all catalytically active JmjC demethylases.
Fig 2
Fig 2. Levels of H3K4me3 are increased in kdmBΔ histones.
MS/MS Base Peak Chromatograms (BPC) of tryptic histone digests analysing peptides T3-R8 of histone H3 show the different variants of methylated K4 and their ratios in the wild type (WT) and the kdmBΔ strain.
Fig 3
Fig 3. H3K4me3 localizes to actively transcribed genes.
A. The metaplot depicts the enrichment pattern of H3K4 trimethylation (H3K4me3), H3K36 trimethylation (H3K36me3), and H3K9/K14 acetylation (H3Ac) for all genes on chromosome 4 in wild type actively growing cells (17h cultures). All genes are aligned to the predicted ATG (position 0) and analysed for a 2 kb window starting with 500 bp of their 5´UTR and promoter sequences (-500) followed by 1500 bp of their coding region (indicated positions within coding region 500, 1000 and 1500 bp). Counts were binned in 10-bp windows and averaged. B. The scatter plots shows the relationship between the average expression level and H3K4me3 enrichment. Values on the x-axis represent the average expression level of each gene determined by RNA-seq from both 17 and 48h cultures (see methods; log2 RPKM). On the y axis, normalized and H3K4me3 levels averaged over the whole gene (log2 RPKM) are shown for each of these genes. Grey dots represent constitutively expressed genes), and genes differentially expressed in the two tested conditions (with a p-value of p ≤0.001) are represented as black or red dots where the latter indicate differentially expressed genes involved in SM biosynthesis.
Fig 4
Fig 4. Genome viewer image presenting the chromatin landscape of chromosome IV in wild type (WT) and kdmB deletion (kdmBΔ) cells grown in liquid shake cultures for 17 hours (primary metabolism).
RNA-seq represents transcriptional activity of the locus. A control ChIP (No Antibody) was performed to detect non-specific ChIP-seq signals.
Fig 5
Fig 5. KdmB influences transcriptional activity and H3K4me3 levels.
The Figure shows global correlation analysis of H3K4me3 levels and KdmB-dependent transcription in nutrient-rich culture cells (primary metabolism). All genes were categorized according to two criteria, i.e. at least 4-fold differential expression in WT and kdmBΔ as well as the degree of H3K4 trimethylation. This resulted in four categories, low (log2 RPKM ≤ 5, panel A) and high (log2 RPKM > 5, panel B) H3K4me3 levels and transcriptional up-/or downregulation in the kdmB mutant. For each open reading frame in these categories, the coverage in CPM (counts per million of reads) was calculated within a 2kb window around the predicted ATG (-500 to +1500) and represents the average enrichment level of this mark. Details on the bioinformatic procedure used to determine CPM values over all points in all genes are given in Materials and Methods. Red lines in the meta-plots indicate CPM values for the WT, while green lines indicate values obtained for kdmBΔ. The number of individual genes in each category and their level of de-regulation are shown in the bar-graph between the meta-plots. Each bar in the graph represents the differential expression value of an individual gene in this group. With this procedure four different correlation groups (G1 –G4) emerged, i.e. genes with low and high H3K4m3 levels requiring KdmB for normal transcription (WT-up/G1 and WT-up/G3, respectively) are expressed stronger in the wild type. Genes with low and high H3K4m3 levels under negative KdmB influence (kdmBΔ-up/G2 and kdmBΔ-up/G4, respectively) are stronger expressed in the kdmBΔ mutant. For all values, p<0.005 was set as threshold. C. Genome viewer image of one representative gene (locus AN6321) within the low H3K4me3 category in which kdmB deletion leads to gain of H3K4me3 (green boxed area) and higher transcription (kdmBΔ-up/G2 gene).
Fig 6
Fig 6. KdmB is required for normal induction of SMB genes.
A. Upper panel: percentage of de-regulated genes in kdmBΔ during PM (17 h) and SM (48 h) with the division into SM cluster genes as annotated in [72] and basic metabolism genes (cell structure and function). Differential expression cut off was set to higher than 4-fold difference (log2 ≥ 2, p<0.05). The lower graph depicts the total number of de-regulated genes in kdmBΔ during PM (17 h) and SM (48 h) cultures,. B. HPLC-chromatograms of supernatant extracts from wild type and kdmBΔ cells growing for 48 hours in conventional AMM or in the special SM-promoting “ZM” medium. a) wild type extract (supernatant, AMM), b) wild type extract (supernatant, ZM), c) kdmBΔ extract (supernatant, AMM), d) kdmBΔ extract (supernatant, ZM). Peaks are assigned to compounds according to standards running in parallel analyses. (1) Austinol, (2) Dehydroaustinol, (3)-Sterigmatocystin, (4) Emericellamide C, (5) Emericellamide D, (6) Orsellinic acid, (7) 2,ω-Dihydroxyemodin, (8) ω-Hydroxyemodin, (9) 2-Hydroxyemodin, (10) Emodin.
Fig 7
Fig 7. Chromatin landscape of the sterigmatocystin gene cluster.
The ST cluster is indicated within the red box, the colour key is in the black box at the bottom of the figure. A. In both WT and kdmBΔ the ST cluster in 17 h cultures (PM) remains silent and lacks the investigated histone marks with the exception of H3K9me3 at stcC). B. The ST cluster is strongly induced at 48h (SM) in the wild type and the cluster genes gain low levels of H3K4me3, H3K36me3 and H3Ac. Levels of H3K9me3 at stcC are decreased in comparison to the flanking H3K9me3 domains under these SM conditions. In kdmBΔ the ST cluster remains almost silent. Unlike in the WT, besides low levels of H3K36me3, other activating histone marks are not detected at the ST locus in kdmBΔ.
Fig 8
Fig 8. Boxplots of ChIP-seq results for Wild Type (WT) and kdmBΔ strains analysed for the two growth-phase dependent conditions, i.e. the two time points of harvesting after 17h (primary metabolism, PM) and 48h (secondary metabolism, SM).
The [log2 (RPKM)] values at the two time points are given for the analysed chromatin modifications (H3K4me3, H3Ac or H3K36me3) and the gene set is divided into functional categories related to “Cell structure and function” (5676 genes) and to genes belonging to “SM clusters” (149 genes). H3K4me3 median of the log2 (RPKM) values for cell structure and function is higher than for SM clusters in all strains and conditions. The differences in H3 acetylation (H3Ac) and H3K36 trimethylation (H3K36me) are not significant between the categories and time points.

Similar articles

Cited by

References

    1. Kouzarides T. Chromatin modifications and their function. Cell. 2007;128(4):693–705. - PubMed
    1. Gardner KE, Allis CD, Strahl BD. Operating on chromatin, a colorful language where context matters. J Mol Biol. 2011;409(1):36–46. 10.1016/j.jmb.2011.01.040 - DOI - PMC - PubMed
    1. Mosammaparast N, Shi Y. Reversal of histone methylation: biochemical and molecular mechanisms of histone demethylases. Annu Rev Biochem. 2010;79:155–79. 10.1146/annurev.biochem.78.070907.103946 - DOI - PubMed
    1. Bannister AJ, Kouzarides T. Regulation of chromatin by histone modifications. Cell Res. 2011;21(3):381–95. 10.1038/cr.2011.22 - DOI - PMC - PubMed
    1. Kiefer CM, Hou C, Little JA, Dean A. Epigenetics of beta-globin gene regulation. Mutat Res. 2008;647(1–2):68–76. 10.1016/j.mrfmmm.2008.07.014 - DOI - PMC - PubMed

MeSH terms