. 2016 Aug 22;12(8):e1005800.
doi: 10.1371/journal.ppat.1005800. eCollection 2016 Aug.

Single-Molecule FISH Reveals Non-selective Packaging of Rift Valley Fever Virus Genome Segments

Affiliations

Single-Molecule FISH Reveals Non-selective Packaging of Rift Valley Fever Virus Genome Segments

Paul J Wichgers Schreur et al. PLoS Pathog. .

Abstract

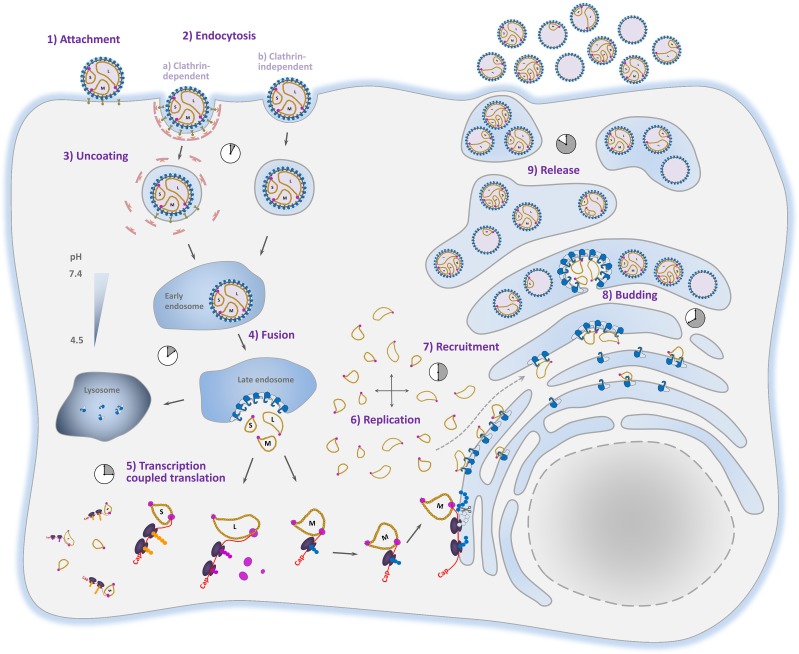
The bunyavirus genome comprises a small (S), medium (M), and large (L) RNA segment of negative polarity. Although genome segmentation confers evolutionary advantages by enabling genome reassortment events with related viruses, genome segmentation also complicates genome replication and packaging. Accumulating evidence suggests that genomes of viruses with eight or more genome segments are incorporated into virions by highly selective processes. Remarkably, little is known about the genome packaging process of the tri-segmented bunyaviruses. Here, we evaluated, by single-molecule RNA fluorescence in situ hybridization (FISH), the intracellular spatio-temporal distribution and replication kinetics of the Rift Valley fever virus (RVFV) genome and determined the segment composition of mature virions. The results reveal that the RVFV genome segments start to replicate near the site of infection before spreading and replicating throughout the cytoplasm followed by translocation to the virion assembly site at the Golgi network. Despite the average intracellular S, M and L genome segments approached a 1:1:1 ratio, major differences in genome segment ratios were observed among cells. We also observed a significant amount of cells lacking evidence of M-segment replication. Analysis of two-segmented replicons and four-segmented viruses subsequently confirmed the previous notion that Golgi recruitment is mediated by the Gn glycoprotein. The absence of colocalization of the different segments in the cytoplasm and the successful rescue of a tri-segmented variant with a codon shuffled M-segment suggested that inter-segment interactions are unlikely to drive the copackaging of the different segments into a single virion. The latter was confirmed by direct visualization of RNPs inside mature virions which showed that the majority of virions lack one or more genome segments. Altogether, this study suggests that RVFV genome packaging is a non-selective process.


Conflict of interest statement

The authors have declared that no competing interests exist.

Figures

Fig 1
Fig 1. Single molecule vRNA FISH of RVFV infected cells in time.
(A) Schematic presentation of the experimental design. (B) Vero cells were infected at MOI 0.1 with RVFV and cells were fixed at 2,4,6,8 and 10 hpi. Cells were subsequently probed against the S segment (N gene) using fluorescein labelled probes (green), against the M segment (Gn gene) using quasar 670 labelled probes (red) and against the L-segment (polymerase gene) using quasar 570 labelled probes (blue). Cell nuclei were visualized with dapi (cyan). Images of individual cells were taken using a wide-field microscope. Magnified images of the squared regions are shown at the right of each panel. The merged images show the spatial relationship between all the different channels.
Fig 2
Fig 2. Quantification of cytoplasmic vRNAs of RVFV, NSR and RVFV-4s infected cells by single molecule FISH.
Vero cells were infected at MOI 0.1 with RVFV (A), NSR (B) or RVFV-4s (C) and cells were fixed at 2,4,6,8 and 10 hpi. RVFV infected cells were subsequently probed against the S segment (N gene) using fluorescein labelled probes, against the M segment (Gn gene) using quasar 670 labelled probes and against the L-segment (polymerase gene) using quasar 570 labelled probes. NSR infected cells were probed against the S segment (N gene, green) using quasar 670 labelled probes and against the L-segment (polymerase gene) using quasar 570 labelled probes. RVFV-4s infected cells were either probed against the S segment (N gene) using fluorescein labelled probes, against the M-Gn segment (Gn gene) using quasar 670 labelled probes and against the L-segment (polymerase gene) using quasar 570 labelled probes or against the S segment (N gene) using fluorescein labelled probes, against the M-Gc segment (Gc gene) using quasar 670 labelled probes and against the L-segment (polymerase gene) using quasar 570 labelled probes. After image acquisition using a widefield microscope, spots were counted as described in the M&M section. The total number of spots (sum spots of all channels) and the relative abundance of each genome segment (in % of total) in the cytoplasm is calculated. The total number of spots (D,E,F) and relative abundance (G,H,I) of each genome segment at the cytoplasm at the indicated time points for RVFV, NSR and RVFV-4s infected cells are indicated. Spot counting data was obtained from >8 cells per experimental variable and means and SDs are presented.
Fig 3
Fig 3. Single molecule vRNA FISH of multiple RVFV infected cells.
RVFV infected Vero cells (MOI 0.1) were fixed at 7 hpi. Cells were subsequently probed against the S segment (N gene) using fluorescein labelled probes (green), against the M segment (Gn and Gc gene) using quasar 670 labelled probes (red) and against the L-segment (polymerase gene) using quasar 570 labelled probes (blue). Cell nuclei were visualized with dapi (cyan). The picture shows that the molar ratios of different vRNAs vary among cells. Most likely the presented cells were infected with either a particle containing a single copy of each genome segment, a particle lacking the M-segment, and a particle with an additional M-segment, respectively. In S2 Fig, additional images are presented.
Fig 4
Fig 4. Colocalization coefficient of vRNAs in RVFV infected cells.
Vero cells were infected at MOI 0.1 with RVFV and cells were fixed at 5 hpi. Cells were subsequently probed against (A) the S segment (N gene, green) using fluorescein labelled probes, the M segment (Gc gene, red) using quasar 670 labelled probes and the GAPDH mRNA using quasar 570 labelled (blue) probes or against (B) the S segment (N gene, green) using fluorescein labelled probes, the M segment (Gc gene, red) using quasar 670 labelled probes and the M-segment using quasar 570 labelled (Gn gene, blue) probes or against the (C) S segment (N gene, green) using fluorescein labelled probes, against the M segment (Gn gene, red) using quasar 670 labelled probes and against the L-segment (polymerase gene, blue) using quasar 570 labelled probes. Cell nuclei were visualized with dapi (cyan). Images were taken using a wide-field microscope. The level of colocalization is determined by calculation of the Pearson’s colocalization coefficient. Bars represent means and SDs of 4 independent measurements.
Fig 5
Fig 5. Single molecule vRNA FISH of NSR infected cells.
(A) Schematic presentation of the experimental setup. (B) Maximal titers and SDs of wild-type RVFV and NSR stocks. (C) Spatio-temporal distribution of genome segments in NSR infected cells. Vero cells were infected at MOI 0.1 with NSR and cells were fixed at 2,4,6,8 and 10 hpi. Cells were subsequently probed against the S segment (N gene, red) using quasar 670 labelled probes and against the L-segment (polymerase gene, green) using quasar 570 labelled probes. Cell nuclei were visualized with dapi (blue). Images were taken using a wide-field microscope. Magnified images of the squared regions are shown at the right of each panel. The merge images show the spatial relationship between all the different channels.
Fig 6
Fig 6. Single molecule vRNA FISH of RVFV-4s infected cells.
(A) Schematic presentation of the experimental setup. Vero cells were infected at MOI 0.1 with RVFV-4s and cells were fixed at 6 (B,C) and 10 (D) hpi. Cells were subsequently probed against (B,D) the S segment (N gene, green) using fluorescein labelled probes, against the M-Gn segment (Gn gene, yellow) using quasar 570 labelled probes and against the M-Gc segment (Gc gene, red) using quasar 670 labelled probes or (C) against the S segment (N gene, green) using fluorescein labelled probes, against the L segment (polymerase gene, yellow) using quasar 570 labelled probes and against the M-Gc segment (Gc gene, red) using quasar 670 labelled probes. Cell nuclei were visualized with dapi (blue). Images were taken using a wide-field microscope. Magnified images of the squared regions are highlighted with white squares. The merged images show the spatial relationship between all the different channels.
Fig 7
Fig 7. Growth of codon shuffled RVFV variants.
(A) Schematic presentation of the viruses with shuffled or codon-optimized genes. (B) Part of the shuffled M segment and codon-optimized N gene sequence. (C) Growth curve of the indicated viruses in Vero cells infected at MOI 0.01. Supernatants were harvested at different time points and titrated on Vero cells.
Fig 8
Fig 8. Genome segment composition of immobilized virions.
(A) Schematic presentation of the experimental setup. (B) Control experiment to validate the visualization of immobilized RVFV virions and their genome segments. Immobilized virions were incubated in the presence (left image) or absence (right image) of the 4-39-cc mAb targeting the Gn glycoprotein followed by incubation with a DyLight 350 labelled conjugate. (C) Validation of the ability to determine segment colocalization inside immobilized virions. Immobilized RVFV virions were hybridized with a quasar 570 labelled Gn gene-specific probe set (green) and a quasar 670 labelled Gc gene-specific probe set (red). Since the Gn and Gc coding regions are both present on the M-genome segment, Gn and Gc gene-specific spots should show a high level of colocalization (in yellow). Colocalization percentages were on average 80% (D) Immobilized RVFV virions were hybridized with S segment specific probe sets (N gene, fluorescein, green), M segment specific probes sets (Gn and Gc, quasar 670, red) and L segment specific probe sets (polymerase, quasar 570, yellow) and incubated with the 4-39-cc Gn specific mAb in combination with the DyLight 350 labelled conjugate (blue). In each channel, spots were subsequently detected with the ComDet plugin of ImageJ and merged images of the four different channels are presented. (E) Quantification of the different genome compositions inside virions. About 800 virions were analysed for their genome content using the ComDet plugin of ImageJ.
Fig 9
Fig 9. Schematic presentation of the RVFV replication cycle.
1) Upon virion attachment, the particles are endocytosed by clathrin-dependent (a) or independent (b) endocytosis. After acidification of the endosome, Gn and Gc undergo conformational changes resulting in fusion of the viral and endosomal membranes and subsequent release of the RNPs into the cytosol. Near the fusion site, the RNPs are used as templates for transcription and replication (5,6). L and S segment-encoded mRNAs are translated by free ribosomes whereas M segment encoded mRNA is translated by membrane bound ribosomes at the ER. Newly formed RNPs (4–6 hpi) migrate to random sites in the cytoplasm initiating additional rounds of replication followed by glycoprotein mediated recruitment to the Golgi (7). Glycoprotein heterodimers or higher-order glycoprotein structures are expected to bind RNPs via interaction of the N protein with the cytoplasmic tail of Gn. Finally, RNPs accumulate at the Golgi and virions are formed by budding into the Golgi lumen (8). Mature virus particles, containing zero to three, or perhaps even more genome segments, are released from the cell via exocytosis (9).

Similar articles

Cited by

References

    1. Flick R, Bouloy M (2005) Rift Valley fever virus. Curr Mol Med 5: 827–834. - PubMed
    1. Elliott RM (1997) Emerging viruses: the Bunyaviridae. Mol Med 3: 572–577. - PMC - PubMed
    1. Ikegami T, Narayanan K, Won S, Kamitani W, Peters CJ, et al. (2009) Rift Valley fever virus NSs protein promotes post-transcriptional downregulation of protein kinase PKR and inhibits eIF2alpha phosphorylation. PLoS Pathog 5: e1000287 10.1371/journal.ppat.1000287 - DOI - PMC - PubMed
    1. Billecocq A, Spiegel M, Vialat P, Kohl A, Weber F, et al. (2004) NSs protein of Rift Valley fever virus blocks interferon production by inhibiting host gene transcription. J Virol 78: 9798–9806. - PMC - PubMed
    1. Bouloy M, Janzen C, Vialat P, Khun H, Pavlovic J, et al. (2001) Genetic evidence for an interferon-antagonistic function of rift valley fever virus nonstructural protein NSs. J Virol 75: 1371–1377. - PMC - PubMed

Publication types