

The Expression of TaRca2-α Gene Associated with Net Photosynthesis Rate, Biomass and Grain Yield in Bread Wheat (Triticum aestivum L.) under Field Conditions
- PMID: 27548477
- PMCID: PMC4993480
- DOI: 10.1371/journal.pone.0161308
The Expression of TaRca2-α Gene Associated with Net Photosynthesis Rate, Biomass and Grain Yield in Bread Wheat (Triticum aestivum L.) under Field Conditions
Abstract
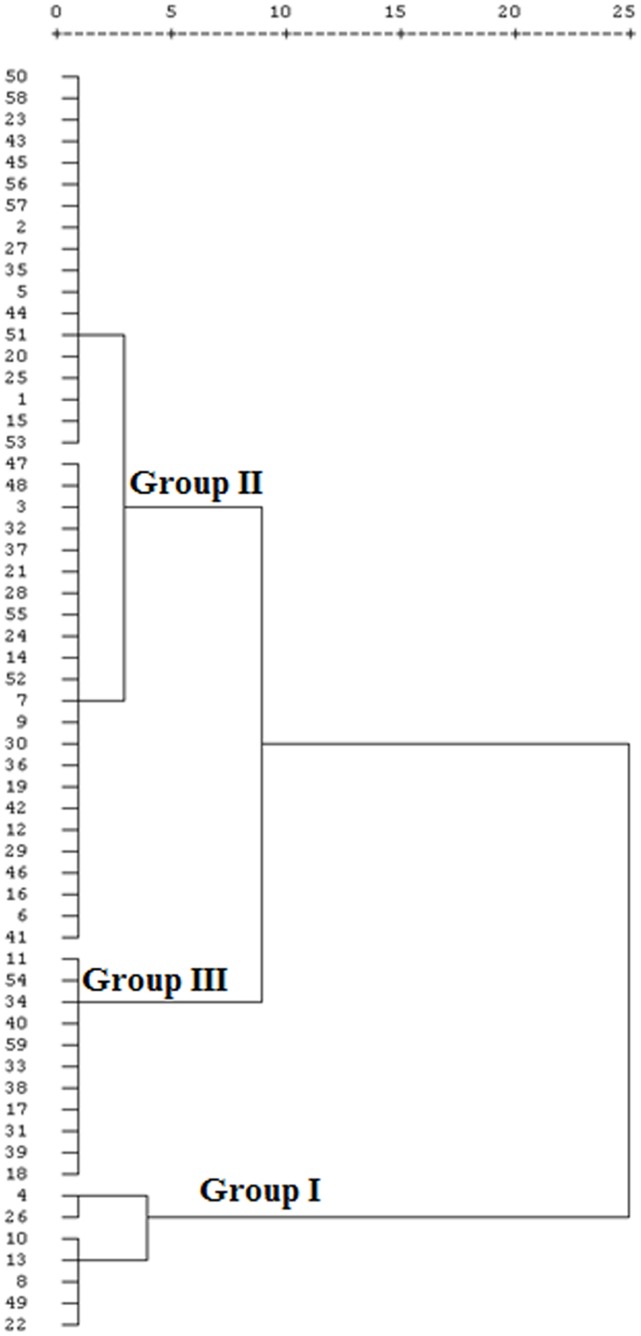
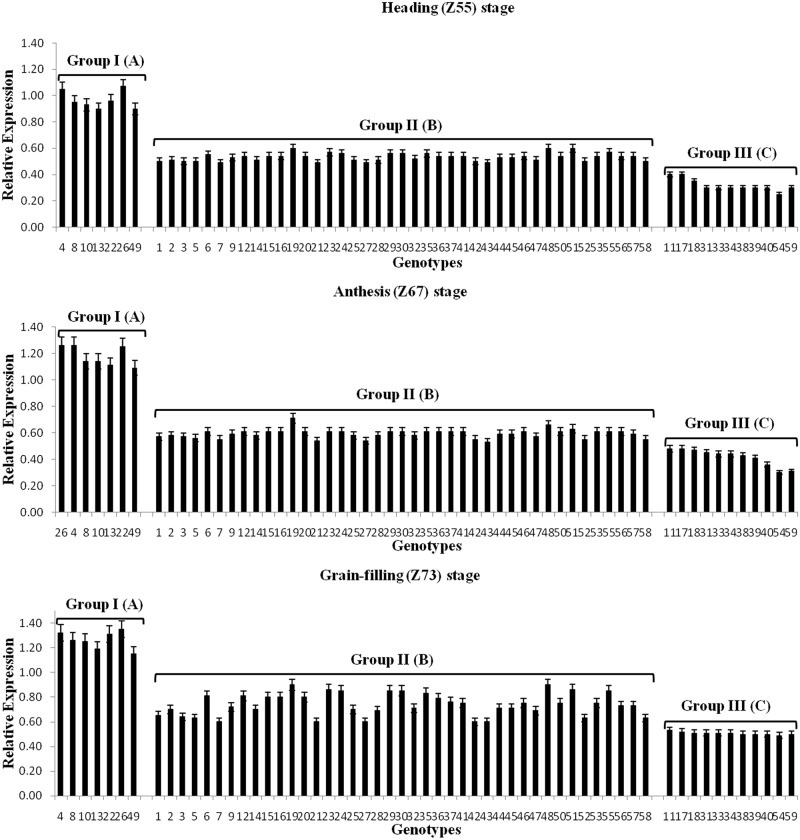
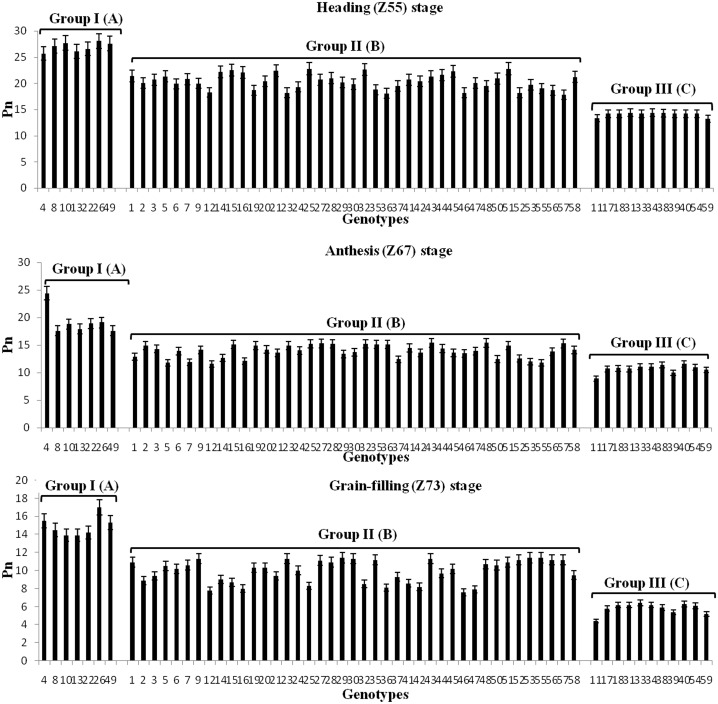
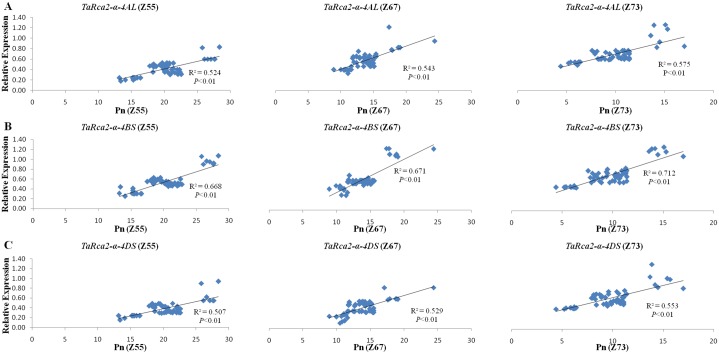
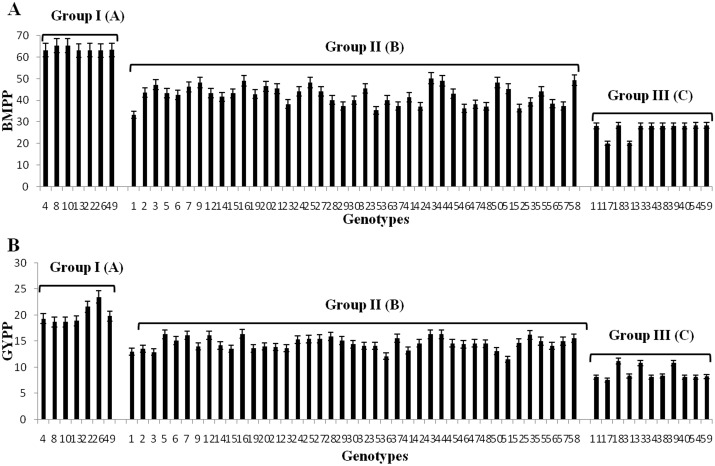
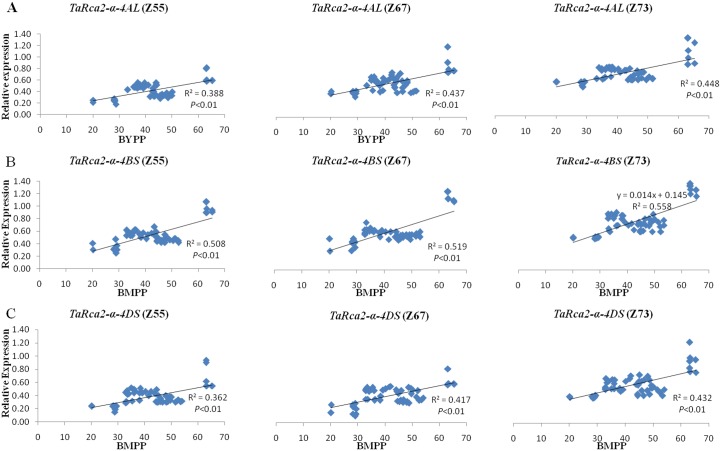
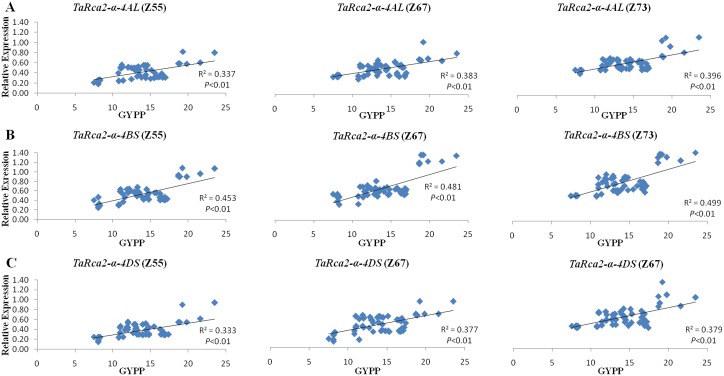
Improvement in activation of Rubisco by Rubisco activase can potentially enhance CO2 assimilation and photosynthetic efficiency in plants. The three homoeologous copies of TaRca2-α were identified on chromosomes 4AL, 4BS and 4DS (TaRca2-α-4AL, TaRca2-α-4BS, and TaRca2-α-4DS) in bread wheat. Expression patterns of the three copies at heading (Z55), anthesis (Z67) and grain-filling (Z73) stages were investigated through qRT-PCR analyses in a panel of 59 bread wheat genotypes and their effects on net photosynthesis rate (Pn), biomass plant-1 (BMPP) and grain yield plant-1 (GYPP) were further explored. Different but similar expression patterns were observed for the three copies of TaRca2-α at the three growth stages with highest expression at grain-filling stage. TaRca2-α-4BS expressed higher at the three stages than TaRca2-α-4AL and TaRca2-α-4DS. The 59 genotypes could be clustered into three groups as high (7 genotypes), intermediate (41 genotypes) and low (11 genotypes) expression based on the expression of the three copies of TaRca2-α at three growth stages. Significant variations (P<0.01) were observed among the three groups of bread wheat genotypes for Pn, BMPP and GYPP. Generally, the genotypes with higher TaRca2-α expression also showed higher values for Pn, BMPP and GYPP. The expressions of the three copies of TaRca2-α at heading, anthesis and grain-filling stages were positively correlated with Pn, BMPP and GYPP (P<0.01) with stronger association for TaRca2-α-4BS at grain-filling stage. These results revealed that the expression of TaRca2-α contribute substantially to Pn, BMPP and GYPP, and suggested that manipulating TaRca-α expression may efficiently improve Pn, BMPP and GYPP in bread wheat and detecting TaRca-α expression levels with emphasis on TaRca2-α-4BS may be a positive strategy for selection in improving photosynthetic efficiency and grain yield of bread wheat.
Conflict of interest statement
The authors have declared that no competing interests exist.
Figures
Similar articles
-
High photosynthetic capability observed in the wheat germplasm with rye chromosomes.J Plant Physiol. 2017 Sep;216:202-211. doi: 10.1016/j.jplph.2017.06.012. Epub 2017 Jul 4. J Plant Physiol. 2017. PMID: 28710914
-
TaER Expression Is Associated with Transpiration Efficiency Traits and Yield in Bread Wheat.PLoS One. 2015 Jun 5;10(6):e0128415. doi: 10.1371/journal.pone.0128415. eCollection 2015. PLoS One. 2015. PMID: 26047019 Free PMC article.
-
The relative abundance of wheat Rubisco activase isoforms is post-transcriptionally regulated.Photosynth Res. 2021 May;148(1-2):47-56. doi: 10.1007/s11120-021-00830-6. Epub 2021 Apr 1. Photosynth Res. 2021. PMID: 33796933 Free PMC article.
-
Raising yield potential of wheat. II. Increasing photosynthetic capacity and efficiency.J Exp Bot. 2011 Jan;62(2):453-67. doi: 10.1093/jxb/erq304. Epub 2010 Oct 27. J Exp Bot. 2011. PMID: 21030385 Review.
-
Avenues for genetic modification of radiation use efficiency in wheat.J Exp Bot. 2000 Feb;51 Spec No:459-73. doi: 10.1093/jexbot/51.suppl_1.459. J Exp Bot. 2000. PMID: 10938854 Review.
Cited by
-
A Conserved Sequence from Heat-Adapted Species Improves Rubisco Activase Thermostability in Wheat.Plant Physiol. 2019 Sep;181(1):43-54. doi: 10.1104/pp.19.00425. Epub 2019 Jun 12. Plant Physiol. 2019. PMID: 31189658 Free PMC article.
-
Molecular Mechanisms of the 1-Aminocyclopropane-1-Carboxylic Acid (ACC) Deaminase Producing Trichoderma asperellum MAP1 in Enhancing Wheat Tolerance to Waterlogging Stress.Front Plant Sci. 2021 Jan 18;11:614971. doi: 10.3389/fpls.2020.614971. eCollection 2020. Front Plant Sci. 2021. PMID: 33537050 Free PMC article.
References
-
- FAO. 2015. http://faostat3.fao.org/home/E.
-
- RE Evenson, Gollin D. Assessing the impact of the green revolution, 1960 to 2000. Science. 2003; 300(5620): 758–762. - PubMed
-
- Rosegrant MW, Agcaoili M. Global food demand, supply, and price prospects to 2010. Washington, DC: International Food Policy Research Institute; 2010.
-
- Fischer RA, Ress D, Sayre KD, Lu ZM, Condon AG, Saavedra AL. Wheat yield progress associated with higher stomatal conductance and photosynthetic rate, and cooler canopies. Crop Sci. 1998; 38: 1467–1475.
MeSH terms
Substances
LinkOut - more resources
Full Text Sources
Other Literature Sources
