. 2016 Aug 22;11(8):e0161175.
doi: 10.1371/journal.pone.0161175. eCollection 2016.

Rhodopsin and Melanopsin Contributions to the Early Redilation Phase of the Post-Illumination Pupil Response (PIPR)

Affiliations

Rhodopsin and Melanopsin Contributions to the Early Redilation Phase of the Post-Illumination Pupil Response (PIPR)

Prakash Adhikari et al. PLoS One. .

Abstract

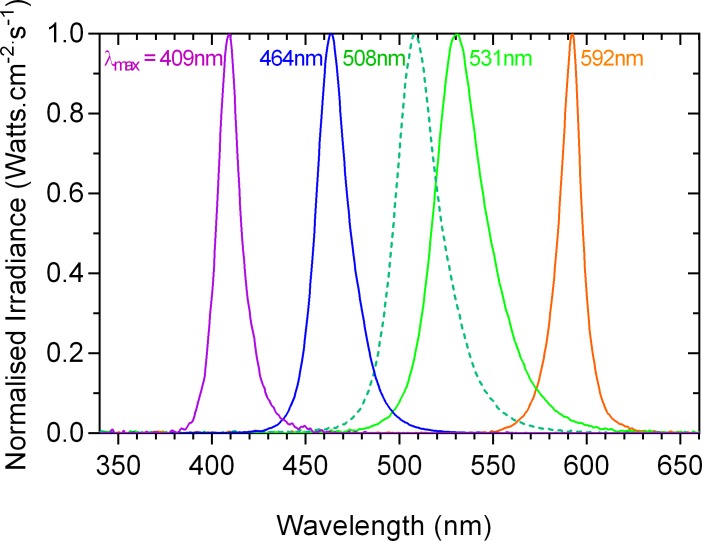
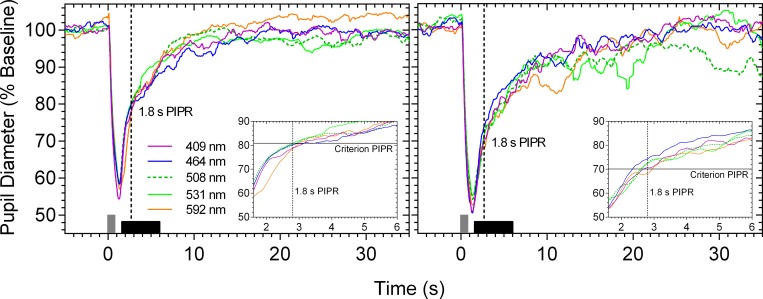
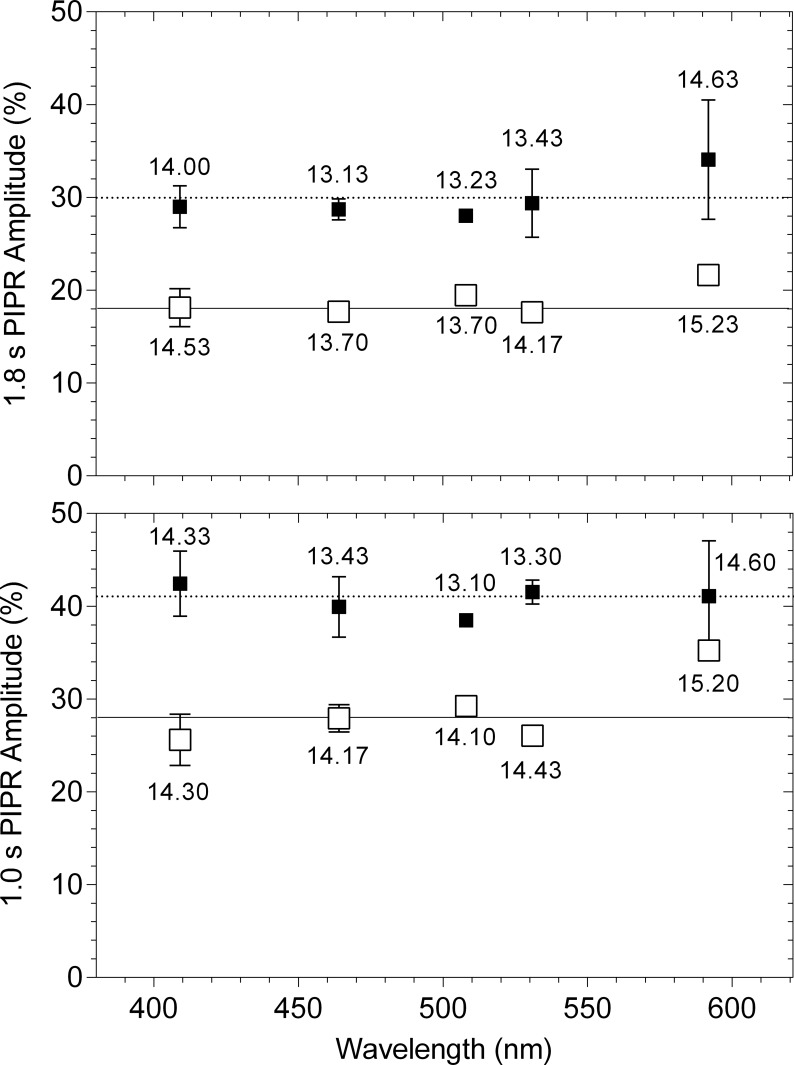
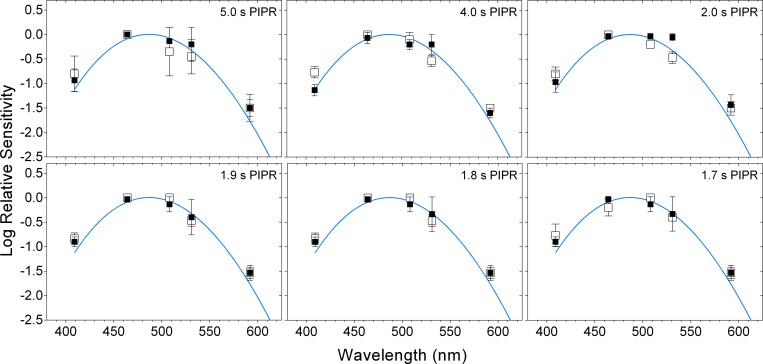
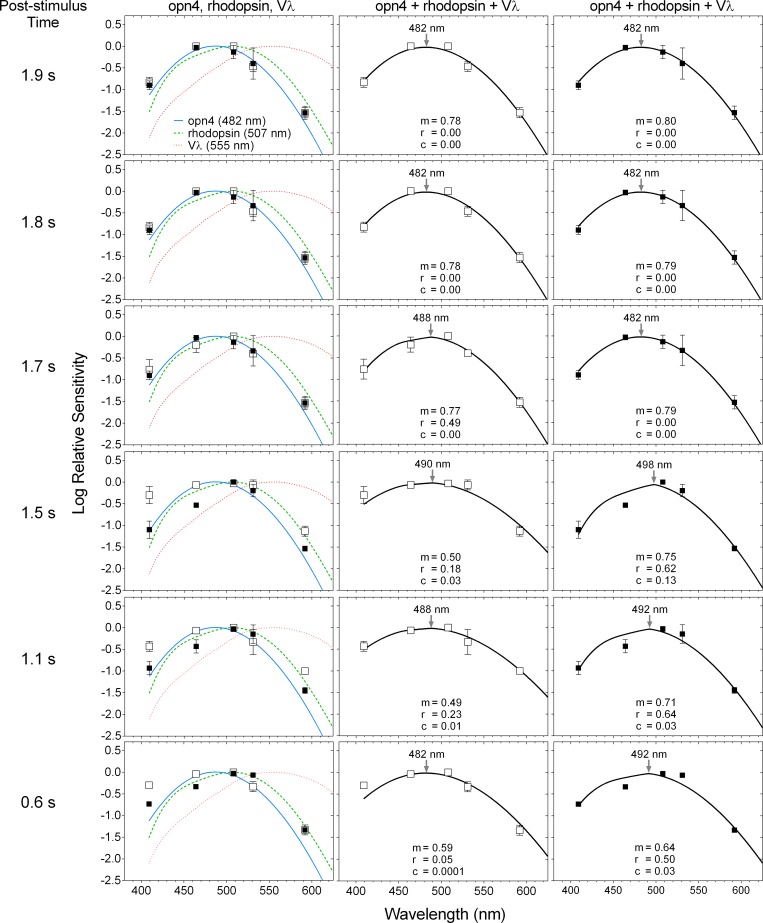
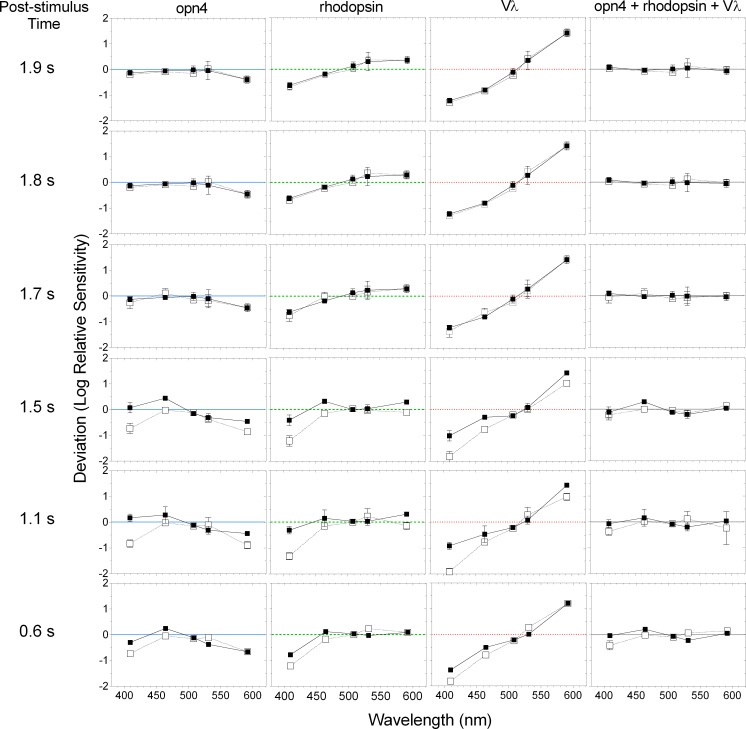
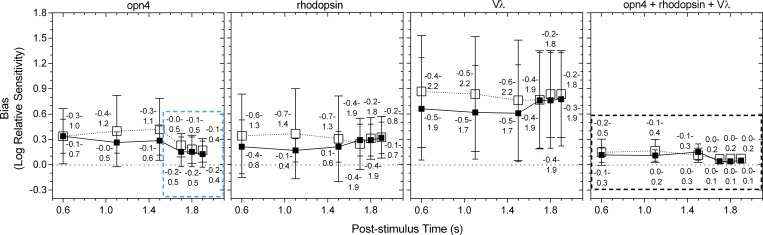
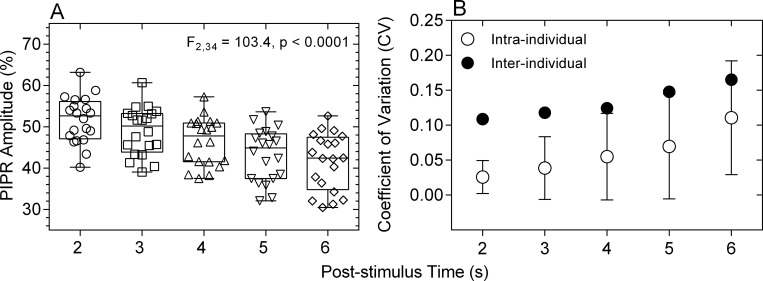
Melanopsin expressing intrinsically photosensitive Retinal Ganglion Cells (ipRGCs) entirely control the post-illumination pupil response (PIPR) from 6 s post-stimulus to the plateau during redilation after light offset. However, the photoreceptor contributions to the early redilation phase of the PIPR (< 6 s post-stimulus) have not been reported. Here, we evaluated the photoreceptor contributions to the early phase PIPR (0.6 s to 5.0 s) by measuring the spectral sensitivity of the criterion PIPR amplitude in response to 1 s light pulses at five narrowband stimulus wavelengths (409, 464, 508, 531 and 592 nm). The retinal irradiance producing a criterion PIPR was normalised to the peak and fitted by either a single photopigment nomogram or the combined melanopsin and rhodopsin spectral nomograms with the +L+M cone photopic luminous efficiency (Vλ) function. We show that the PIPR spectral sensitivity at times ≥ 1.7 s after light offset is best described by the melanopsin nomogram. At times < 1.7 s, the peak PIPR sensitivity shifts to longer wavelengths (range: 482 to 498 nm) and is best described by the combined photoreceptor nomogram, with major contributions from melanopsin and rhodopsin. This first report of melanopsin and rhodopsin contributions to the early phase PIPR is in line with the electrophysiological findings of ipRGC and rod signalling after the cessation of light stimuli and provides a cut-off time for isolating photoreceptor specific function in healthy and diseased eyes.


Conflict of interest statement

The authors have declared that no competing interests exist.

Figures

Fig 1
Fig 1. Spectral output of the primary lights.
The bandwidths at half maximum output (in nm) are specified in parentheses after the dominant wavelengths (in nm) of the primary lights: 409 (14), 464 (20), 508 (27), 531 (31) and 592 nm (14 nm).
Fig 2
Fig 2. Schematic of the pupillometry protocol.
Each experimental session started with 10 minutes pre-adaptation. The order of presentation of the stimulus wavelengths was randomised to maintain a minimum difference of 100 nm between successive stimuli. The example test protocol for the 409 nm stimulus (upper schematic) was common for all wavelengths. There was a two-minute inter-stimulus interval between the tests to allow for the pupil to return to the baseline size. A minimum of four irradiances were presented in 0.2 log quanta.cm-2.s-1 intervals at each wavelength and a minimum of three repeated measurements were recorded at each irradiance. PRE = pre-stimulus; PIPR = post-illumination pupil response.
Fig 3
Fig 3
Exemplar pupil light reflex traces of participant 32/F (left panel) and participant 31/M (right panel) in response to five test wavelengths to produce a criterion PIPR amplitude (% of baseline pupil diameter) at 1.8 s after light offset. The vertical grey bar at 0 s indicates the 1 s stimulus pulse. The horizontal black bar along the abscissa indicates the post-stimulus period (0.6 to 5.0 s) where the PIPR spectral sensitivity was measured. The insets show a magnified view of the traces (0.6 to 5.0 s post-stimulus). The vertical dashed lines in all panels indicate the 1.8 s PIPR time and the horizontal solid lines in the insets indicate the criterion PIPR amplitude.
Fig 4
Fig 4. Difference (% of baseline pupil diameter) between the measured PIPR (symbols) and criterion PIPR (horizontal lines) for each primary light at 1.0 and 1.8 s after light offset.
The unfilled and filled squares indicate the data (average ± SD) from participant 32/F and participant 31/M, respectively. The average retinal irradiance (log quanta.cm-2.s-1) required to produce the criterion PIPR is given for each wavelength.
Fig 5
Fig 5. Spectral sensitivity of the post-illumination pupil response (PIPR) at 1.7 to 5.0 s after light offset.
The unfilled and filled squares indicate the data (average ± SD) from participant 32/F and participant 31/M, respectively; the blue curves indicate the melanopsin (opn4) spectral sensitivity nomogram.
Fig 6
Fig 6. Spectral sensitivity of the post-illumination pupil response (PIPR) at 0.6 to 1.9 s after light offset.
The unfilled and filled squares indicate the data (average ± SD) from participant 32/F and participant 31/M, respectively. The curve fitting with the opn4 + rhodopsin + Vλ nomogram is separately shown for each participant in the middle (32/F) and right (31/M) panels; m, r and c are relative contributions to the PIPR from opn4, rhodopsin and Vλ, respectively (Eq 1). The nomogram peaks are indicated by the arrows in the middle and right panels.
Fig 7
Fig 7. Deviation of the criterion PIPR data from the single opn4, rhodopsin and Vλ spectral sensitivity nomograms, and the combined opn4 + rhodopsin + Vλ nomogram at 0.6 to 1.9 s after light offset.
The unfilled and filled squares indicate the data (average ± SD) from participant 32/F and participant 31/M, respectively; the horizontal lines indicate no deviation from the nomograms.
Fig 8
Fig 8. Bland-Altman analysis of the agreement between the criterion PIPR data and the single opn4, rhodopsin, Vλ spectral nomograms, and the combined opn4 + rhodopsin + Vλ nomogram at 0.6 to 1.9 s after light offset.
The unfilled and filled squares indicate the data (average ± SD) from participant 32/F and participant 31/M, respectively. The numbers above and below the symbols indicate the 95% limits of agreement between the nomogram and PIPR for participant 32/F and participant 31/M, respectively. The horizontal dotted lines indicate zero bias; the dotted boxes highlight the nomograms providing the best fit.
Fig 9
Fig 9
Amplitudes (% of baseline pupil diameter) (Panel A) and intra- and inter-individual coefficients of variation (CV) (Panel B) of the 2, 3, 4, 5 and 6 s PIPR. Data from a sample of 20 observers with normal ocular health, aged between 35 and 74 years. In panel A, smaller percentage baseline values on the ordinate indicate smaller PIPR amplitudes.

Similar articles

Cited by

References

    1. Gamlin PD, McDougal DH, Pokorny J, Smith VC, Yau KW, Dacey DM. Human and macaque pupil responses driven by melanopsin-containing retinal ganglion cells. Vision Res. 2007;47: 946–954. - PMC - PubMed
    1. Feigl B, Zele AJ. Melanopsin-expressing intrinsically photosensitive retinal ganglion cells in retinal disease. Optom Vis Sci. 2014;91: 894–903. 10.1097/OPX.0000000000000284 - DOI - PubMed
    1. Adhikari P, Zele AJ, Feigl B. The post-illumination pupil response (PIPR). Invest Ophthalmol Vis Sci. 2015;56: 3838–3849. 10.1167/iovs.14-16233 - DOI - PubMed
    1. Kankipati L, Girkin CA, Gamlin PD. Post-illumination pupil response in subjects without ocular disease. Invest Ophthalmol Vis Sci. 2010;51: 2764–2769. 10.1167/iovs.09-4717 - DOI - PMC - PubMed
    1. Markwell EL, Feigl B, Zele AJ. Intrinsically photosensitive melanopsin retinal ganglion cell contributions to the pupillary light reflex and circadian rhythm. Clin Exp Optom. 2010;93: 137–149. 10.1111/j.1444-0938.2010.00479.x - DOI - PubMed

LinkOut - more resources