. 2016 Sep 1;126(9):3511-25.
doi: 10.1172/JCI84871. Epub 2016 Aug 22.

Opposing actions of angiopoietin-2 on Tie2 signaling and FOXO1 activation

Opposing actions of angiopoietin-2 on Tie2 signaling and FOXO1 activation

Minah Kim et al. J Clin Invest. .

Abstract

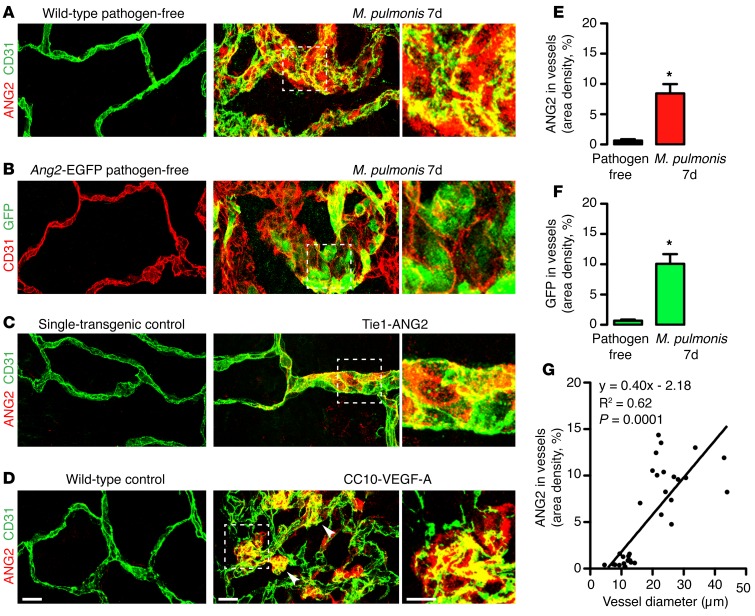
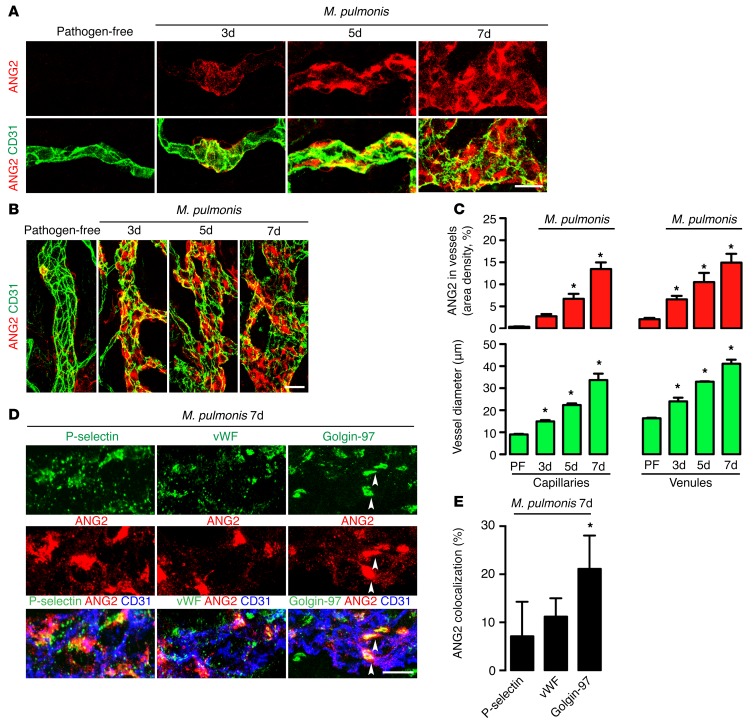
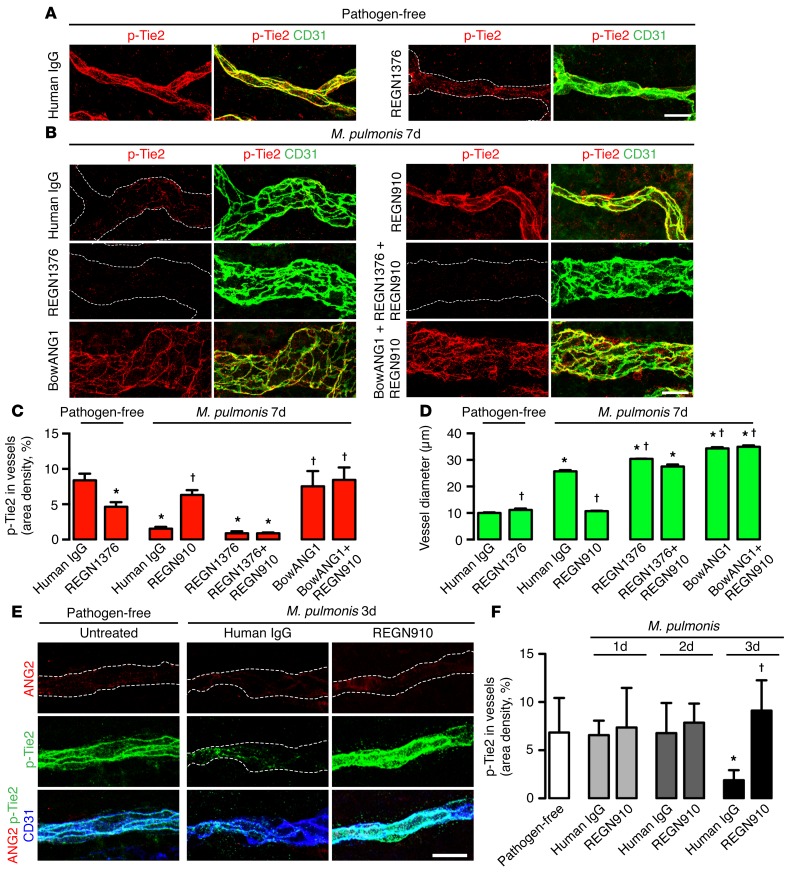
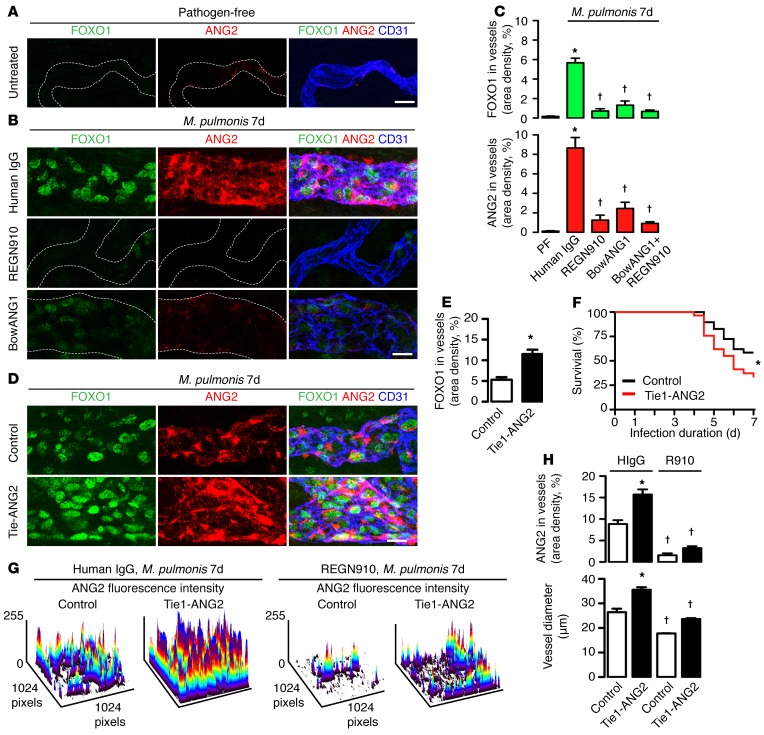
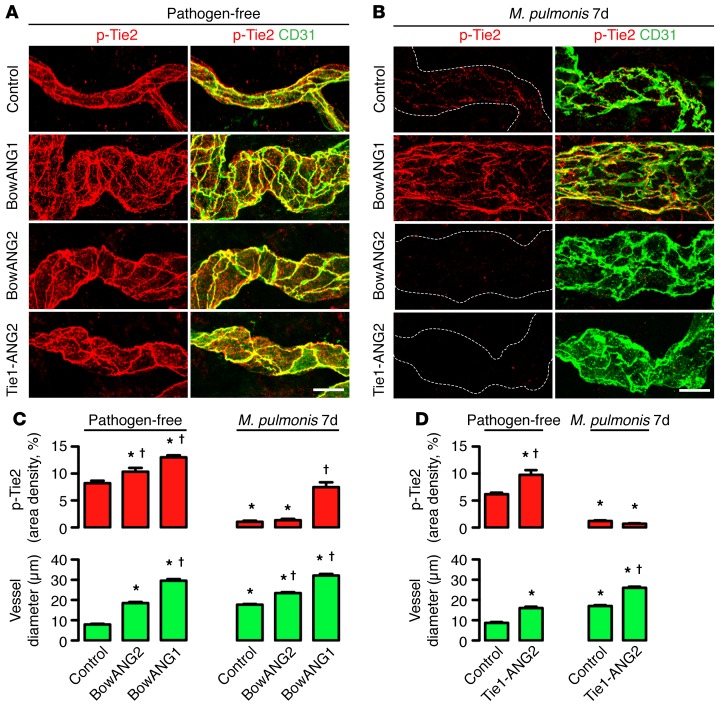
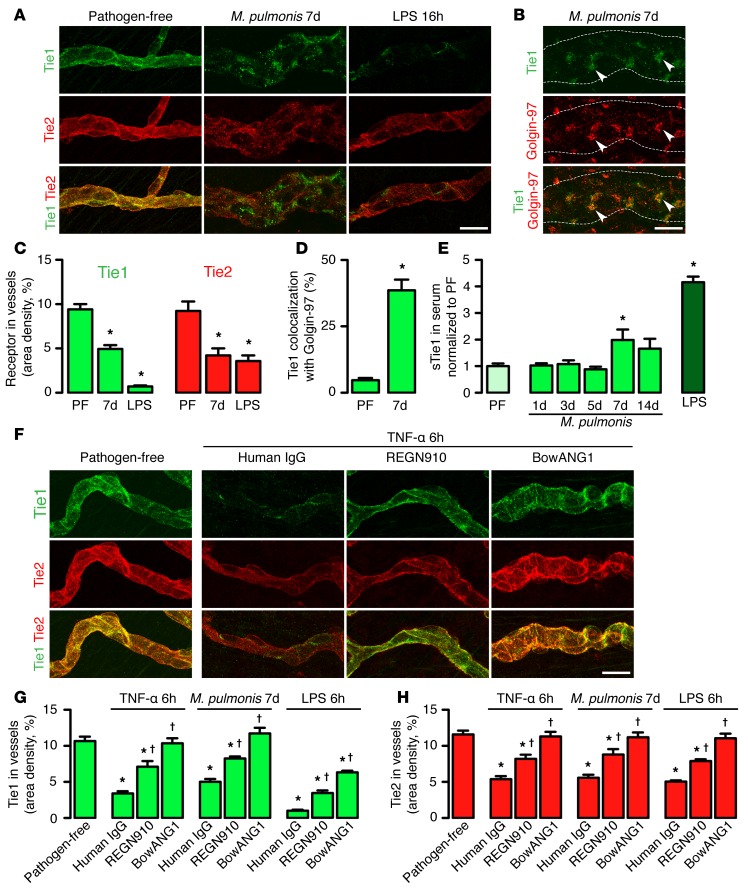
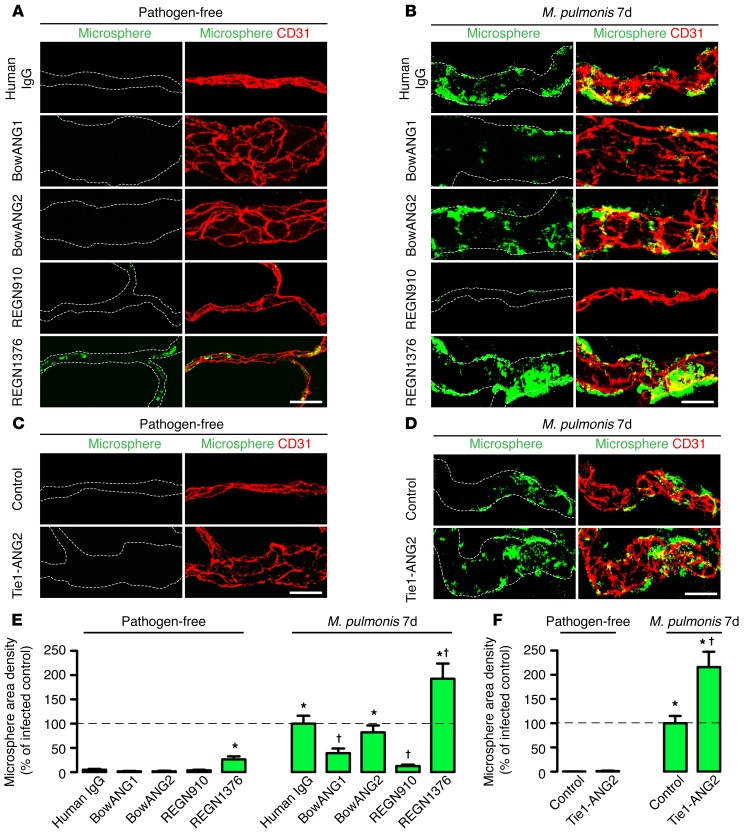
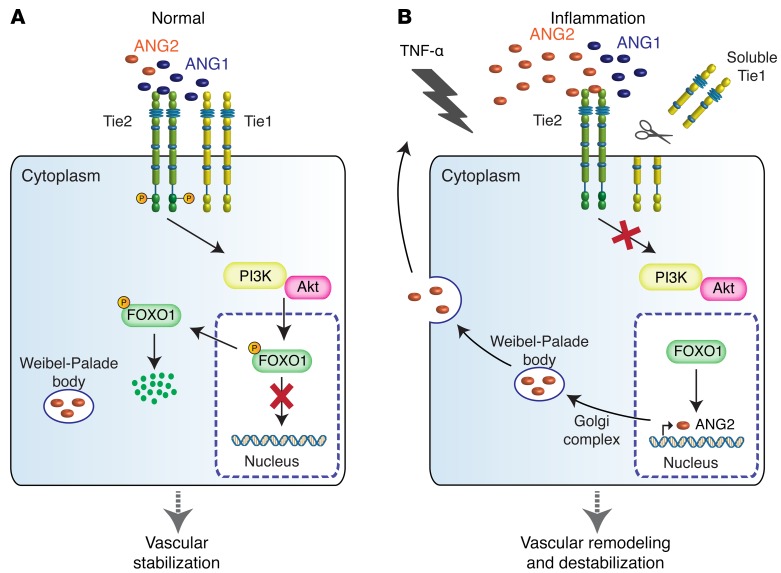
Angiopoietin-2 (ANG2) regulates blood vessel remodeling in many pathological conditions through differential effects on Tie2 signaling. While ANG2 competes with ANG1 to inhibit Tie2, it can paradoxically also promote Tie2 phosphorylation (p-Tie2). A related paradox is that both inactivation and overactivation of Tie2 can result in vascular remodeling. Here, we reconciled these opposing actions of ANG2 by manipulating conditions that govern its actions in the vasculature. ANG2 drove vascular remodeling during Mycoplasma pulmonis infection by acting as a Tie2 antagonist, which led to p-Tie2 suppression, forkhead box O1 (FOXO1) activation, increased ANG2 expression, and vessel leakiness. These changes were exaggerated by anti-Tie2 antibody, inhibition of PI3K signaling, or ANG2 overexpression and were reduced by anti-ANG2 antibody or exogenous ANG1. In contrast, under pathogen-free conditions, ANG2 drove vascular remodeling by acting as an agonist, promoting high p-Tie2, low FOXO1 activation, and no leakage. Tie1 activation was strong under pathogen-free conditions, but infection or TNF-α led to Tie1 inactivation by ectodomain cleavage and promoted the Tie2 antagonist action of ANG2. Together, these data indicate that ANG2 activation of Tie2 supports stable enlargement of normal nonleaky vessels, but reduction of Tie1 in inflammation leads to ANG2 antagonism of Tie2 and initiates a positive feedback loop wherein FOXO1-driven ANG2 expression promotes vascular remodeling and leakage.


Figures

Figure 1
Figure 1. ANG2 expression in endothelial cells at sites of vascular remodeling.
(A and B) Weak or absent ANG2 immunofluorescence in normal tracheal blood vessels of pathogen-free wild-type mouse (A) and Ang2-EGFP mouse (B) compared with strong ANG2 staining in remodeled vessels in both types of mice after M. pulmonis infection for 7 days. (C) Comparison of no ANG2 staining in vessels of control mouse with strong staining in enlarged vessels after ANG2 overexpression in endothelial cells of Tie1-ANG2 mouse off doxycycline from birth to 8 weeks. (D) Comparison of no ANG2 staining in vessels of control mouse with strong staining in bulbous vascular expansions (arrowheads) after VEGF-A overexpression in CC10–VEGF-A mouse on doxycycline for 7 days. Boxed region enlarged on the right. Scale bars: 10 μm. (E and F) Comparison of ANG2 immunofluorescence of tracheal blood vessels in C57BL/6 mice (E) and EGFP staining in Ang2-EGFP mice (F) under pathogen-free conditions and after infection for 7 days (n = 12 per group). *P < 0.05 vs. pathogen-free, Student’s t test. (G) Correlation (P = 0.0001) between amount of ANG2 staining and size of 34 tracheal vessels in 12 pathogen-free Tie1-ANG2 mice off doxycycline from birth to 8 weeks of age.
Figure 2
Figure 2. Temporal change in ANG2 expression and subcellular distribution during vascular remodeling after infection.
(A) Progressive increase in ANG2 immunofluorescence at sites of capillary remodeling over cartilage rings at days 3, 5, and 7 after M. pulmonis infection in C3H mice. ANG2 staining in enlarged vessel is strong at 3 days and even stronger and more uniform at 7 days after infection. (B) More rapid increase in ANG2 at sites of venule remodeling between cartilage rings at 3 days after infection. ANG2 staining is uniformly strong in venules at days 3, 5, and 7 of infection. Scale bars: 25 μm (A and B). (C) Parallel increases in amount of ANG2 staining (upper) and size of capillaries and venules (lower) after infection (n = 9 per group). *P < 0.05 vs. pathogen-free, 1-way ANOVA. (D) Strong colocalization of ANG2 with golgin-97 and weak colocalization with P-selectin and vWF in blood vessels at 7 days after infection in C57BL/6 mice. Arrowheads mark sites of ANG2 colocalization with golgin-97. Scale bar: 10 μm. (E) Significantly greater colocalization of ANG2 with golgin-97 than with P-selectin or vWF (n = 9 per group). *P < 0.05 vs. P-selectin or vWF, 1-way ANOVA.
Figure 3
Figure 3. ANG2 effects on Tie2 phosphorylation and vascular enlargement.
(A) Blood vessels of pathogen-free mice comparing strong p-Tie2 staining in a control (human IgG) with weak p-Tie2 after inhibition of Tie2 by REGN1376. (B) Blood vessels after M. pulmonis infection for 7 days showing weak p-Tie2 in remodeled vessels in a control (human IgG) compared with strong p-Tie2 after inhibition of total2 by REGN910. Weak or absent p-Tie2 after REGN1376 alone or with REGN910, but stronger p-Tie2 after BowANG1 or BowANG1 plus REGN910, indicating that BowANG1 overcame ANG2 suppression of Tie2 after infection. ANG2 inhibition also reduced vascular remodeling, but Tie2 inhibition exaggerated the enlargement and blocked the effect of REGN910. BowANG1 alone or together with REGN910 amplified the enlargement. Dashed white lines delineate vessels stained by CD31. (C and D) Measurements of p-Tie2 staining (C) and vessel size (D), comparing groups shown in A and B (n = 12 per group). *P < 0.05 vs. pathogen-free IgG controls; P < 0.05 vs. infected IgG controls, 1-way ANOVA. (E) Comparison of ANG2 and p-Tie2 at baseline after 3 days of infection, showing that p-Tie2 reduction after infection was blocked by ANG2 inhibition. ANG2 staining was weak in all groups at this time point. Scale bars: 20 μm. (F) Measurements showing that the reduction in p-Tie2 staining after infection was not evident until 3 days and that this reduction was blocked by inhibition of ANG2 (n = 6 per group). *P < 0.05 vs. pathogen-free control; P < 0.05 vs. infected IgG controls at 3 days, 1-way ANOVA.
Figure 4
Figure 4. ANG2-dependent parallel increase in FOXO1 activation and ANG2 expression after infection.
(A) Weak or absent FOXO1 and ANG2 immunofluorescence in normal vessel of pathogen-free wild-type mouse. (B) Blood vessels of mice with M. pulmonis infection for 7 days, showing strong nuclear FOXO1 staining and cytoplasmic ANG2 in a remodeled vessel after control treatment (human IgG). FOXO1 and ANG2 are weak after ANG2 blockade by REGN910 or after Tie2 overactivation by BowANG1 alone or with REGN910. Dashed white lines delineate vessel borders marked by CD31. (C) Measurements of FOXO1 (top) and ANG2 (bottom) staining in groups shown in A and B (n = 12 per group). *P < 0.05 vs. pathogen-free controls; P < 0.05 vs. infected IgG controls, 1-way ANOVA. (D) Comparison of control and Tie1-ANG2 mice infected for 7 days showing strong FOXO1 and ANG2 immunoreactivity, exaggerated in Tie1-ANG2 mouse. (E) Measurements comparing amounts of FOXO1 staining in infected control and Tie1-ANG2 mice (n = 6 per group). *P < 0.05, Student’s t test. (F) Kaplan-Meier survival curves for control (black) and Tie1-ANG2 (red) mice over 7 days of infection (n = 21 per group). *P < 0.05, log-rank test. (G) Surface plots of confocal microscopic images showing intensity of ANG immunofluorescence in control and Tie1-ANG2 mice infected for 7 days and treated with control antibody (human IgG) or anti-ANG2 (REGN910). Increase in ANG2 immunofluorescence and vascular enlargement after infection was exaggerated in Tie1-ANG2 mice, blocked by REGN910. Scale bars: 20 μm. (H) Measurements showing amounts of ANG2 immunofluorescence (upper) and vessel size (lower) in groups shown in G (n = 12 per group). *P < 0.05 vs. corresponding control group; P < 0.05 vs. corresponding IgG-treated group, 1-way ANOVA.
Figure 5
Figure 5. Contrasting actions of ANG2 with or without infection.
(A) Strong p-Tie2 immunofluorescence in pathogen-free control mouse, wild-type mouse given BowANG1 or BowANG2 for 7 days, and Tie1-ANG2 mouse aged 8 weeks. (B) Comparison of the same 4 groups after 7 days of M. pulmonis infection, where p-Tie2 staining is much weaker in all mice except the one treated with BowANG1. Dashed white lines delineate vessel borders marked by CD31. Scale bars: 20 μm. (C and D) Measurement of p-Tie2 immunofluorescence (upper) and vessel size (lower) in pathogen-free or infected wild-type mice given BowANG1 or BowANG2 for 7 days (C) and Tie1-ANG2 mice aged 8 weeks (D) compared with respective controls (n = 4–5 per group). *P < 0.05 vs. pathogen-free controls; P < 0.05 vs. infected controls, 1-way ANOVA.
Figure 6
Figure 6. Reduction in endothelial Tie1 and Tie2 after M.
pulmonisinfection or TNF-α. (A) Strong Tie1 and Tie2 staining of tracheal blood vessels under pathogen-free conditions compared with weaker staining after M. pulmonis infection for 7 days. LPS for 16 hours (15 mg/kg i.p.) included as a positive control in A, C, and E (38). (B) Strong colocalization of Tie1 with golgin-97 in enlarged vessels after infection for 7 days. (C) Reduction in Tie1 and Tie2 after infection or LPS (n = 8 per group). *P < 0.05 vs. PF controls, 1-way ANOVA. (D) Greater colocalization of Tie1 and golgin-97 after infection than in pathogen-free controls, assessed by Imaris software (n = 4 per group). *P < 0.05 vs. pathogen-free controls, Student’s t test. (E) Comparison of soluble Tie1 in serum at 1, 3, 5, 7, and 14 days after infection or 16 hours after LPS (15 mg/kg i.p.) normalized to pathogen-free control (n = 5–10 per group). *P < 0.05 vs. pathogen-free controls, 1-way ANOVA. (F) Strong Tie1 and Tie2 in controls compared with weak staining after TNF-α for 6 hours (0.24 mg/kg i.v.) preceded by control human IgG. Less reduction in Tie1 and Tie2 when TNF-α was preceded by anti-ANG2 antibody REGN910 and no reduction when TNF-α was preceded by Tie2-agonist BowANG1. Scale bars: 20 μm. (G and H) Tie1 (G) and Tie2 (H) in vessels of groups shown in F, and after infection for 7 days or LPS for 6 hours (n = 8 per group). *P < 0.05 vs. PF controls; P < 0.05 vs. corresponding IgG controls, 1-way ANOVA.
Figure 7
Figure 7. Differences in endothelial barrier function after Tie2 inactivation or overactivation.
(A) Comparison of blood vessel leakiness and size in trachea of pathogen-free mice given control antibody (human IgG), BowANG1, BowANG2, anti-ANG2 (REGN910), or anti-Tie2 (REGN1376) for 7 days. BowANG1 and BowANG2 increased vessel size, but only Tie2 blockade resulted in leakage in pathogen-free mice. (B) Similar comparison in mice given the same treatments as in A but during M. pulmonis infection for 7 days. Vessels were leaky and enlarged in all groups except when ANG2 was blocked, where little leakage or enlargement was found. BowANG1 reduced leakage and exaggerated enlargement, but BowANG2 had comparable leakage with infected controls. (C and D) Comparison of vessel leakiness and size in pathogen-free (C) and infected (D) controls and Tie1-ANG2 mice aged 8 weeks, showing that ANG2 overexpression increased vessel size, but not leakage, under pathogen-free conditions and exaggerated both enlargement and leakage after infection. Dashed white lines delineate vessel borders marked by CD31. Scale bars: 25 μm. (E) Measurement of leakage in the same groups as shown in A and B (n = 4–10 per group). *P < 0.05 vs. pathogen-free IgG control; P < 0.05 infected with treatment vs. infected IgG control, 1-way ANOVA. (F) Measurement of leakage in the same groups as shown in C and D (n = 4–8 per group). *P < 0.05 vs. pathogen-free control; P < 0.05 infected Tie1-ANG2 vs. infected control, 1-way ANOVA.
Figure 8
Figure 8. Diagram of regulatory loop linking ANG1, ANG2, Tie1, and Tie2 in endothelial cells.
(A) Under normal conditions, the agonist action of ANG1 dominates ANG2 in activating Tie2 signaling in a Tie1-dependent manner (38), leading to PI3K/Akt pathway activation. Akt-dependent phosphorylation of FOXO1 suppresses transcriptional function by promoting nuclear exclusion, ubiquitination, and degradation, which increases expression of genes that promote vascular stabilization. (B) After M. pulmonis infection, TNF-α is released, Tie1 is reduced by ectodomain shedding, and Tie2 phosphorylation is suppressed by ANG2 secreted from Weibel-Palade bodies. PI3K/Akt pathway inactivation promotes FOXO1 transcriptional activity and increases expression of ANG2 and other vascular destabilizing genes. The antagonistic action of greater ANG2 dominates the agonist action of ANG1, maintains suppression of Tie2 signaling, and establishes a positive feedback loop, with sustained Akt inactivation, FOXO1 transcriptional activation, and ANG2 production. Vascular destabilization, remodeling, and leakiness are downstream consequences of this ANG2-Tie2 regulatory loop after infection.

Comment in

References

    1. Augustin HG, Koh GY, Thurston G, Alitalo K. Control of vascular morphogenesis and homeostasis through the angiopoietin-Tie system. Nat Rev Mol Cell Biol. 2009;10(3):165–177. - PubMed
    1. Baluk P, et al. TNF-alpha drives remodeling of blood vessels and lymphatics in sustained airway inflammation in mice. J Clin Invest. 2009;119(10):2954–2964. doi: 10.1172/JCI37626. - DOI - PMC - PubMed
    1. Lee CG, et al. Vascular endothelial growth factor (VEGF) induces remodeling and enhances TH2-mediated sensitization and inflammation in the lung. Nat Med. 2004;10(10):1095–1103. doi: 10.1038/nm1105. - DOI - PMC - PubMed
    1. Tabruyn SP, et al. Angiopoietin-2-driven vascular remodeling in airway inflammation. Am J Pathol. 2010;177(6):3233–3243. doi: 10.2353/ajpath.2010.100059. - DOI - PMC - PubMed
    1. Sato TN, et al. Distinct roles of the receptor tyrosine kinases Tie-1 and Tie-2 in blood vessel formation. Nature. 1995;376(6535):70–74. doi: 10.1038/376070a0. - DOI - PubMed

Publication types

MeSH terms