. 2016 Dec;15(12):1287-1296.
doi: 10.1038/nmat4729. Epub 2016 Aug 22.

Transcription upregulation via force-induced direct stretching of chromatin

Affiliations

Transcription upregulation via force-induced direct stretching of chromatin

Arash Tajik et al. Nat Mater. 2016 Dec.

Abstract

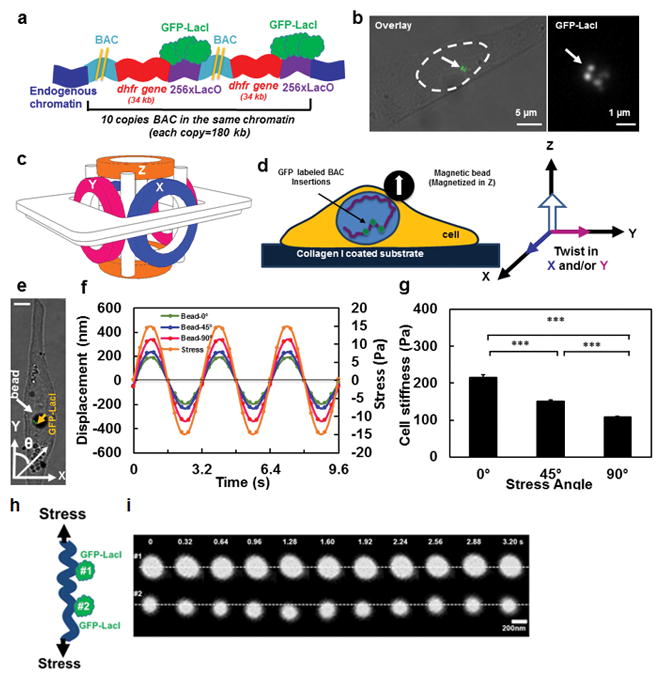
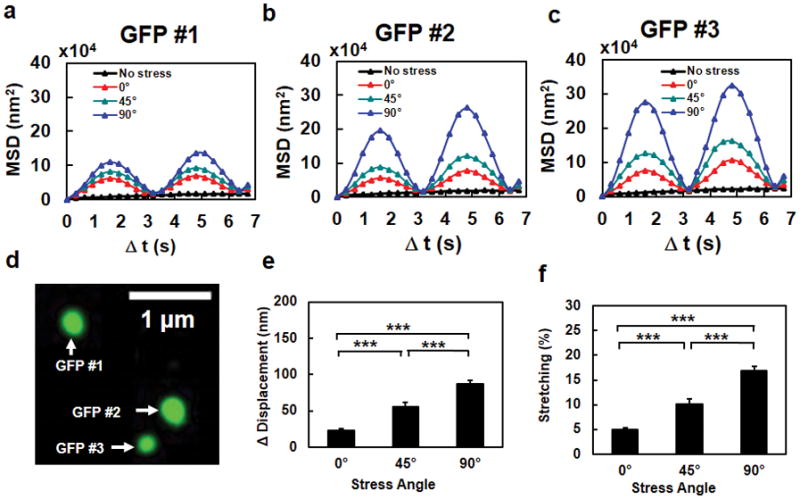
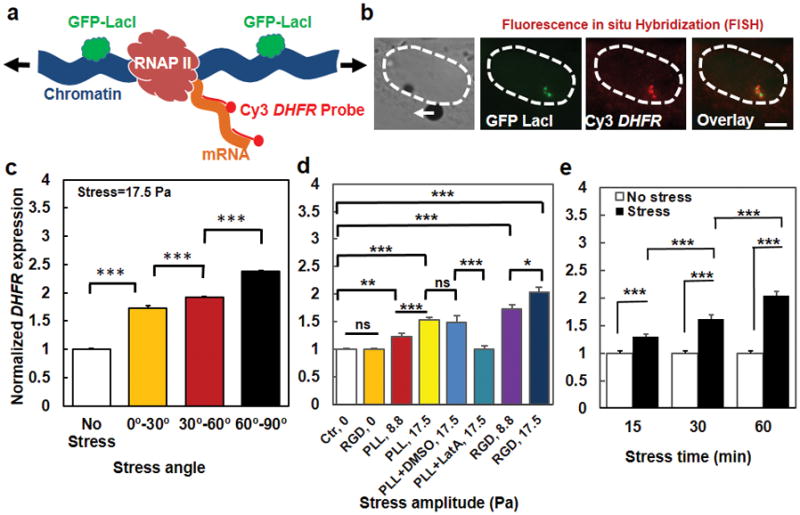
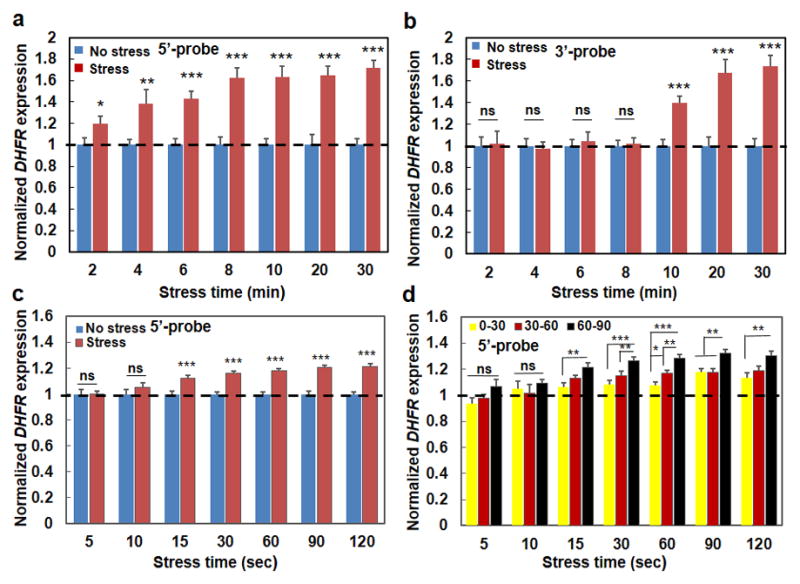
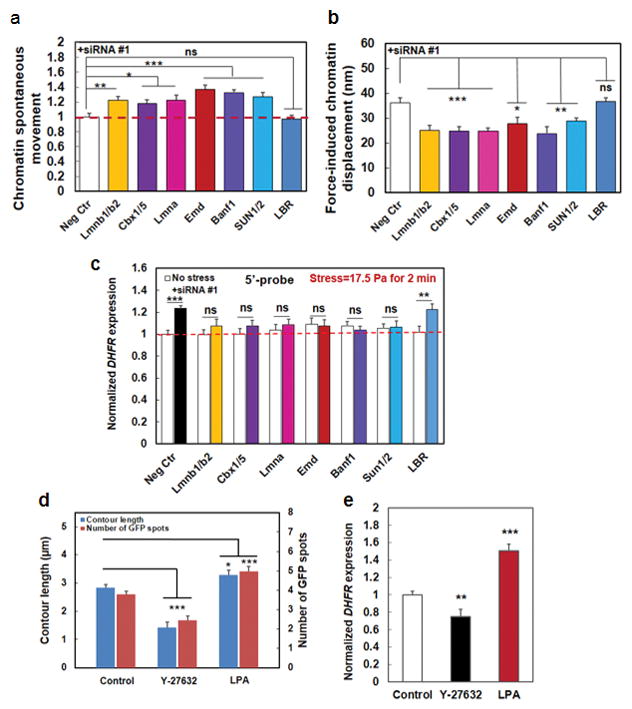
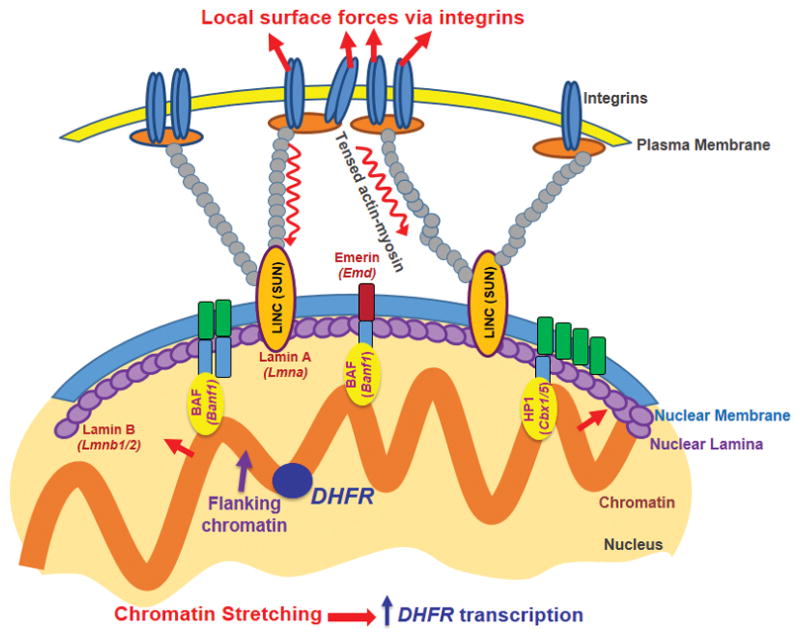
Mechanical forces play critical roles in the function of living cells. However, the underlying mechanisms of how forces influence nuclear events remain elusive. Here, we show that chromatin deformation as well as force-induced transcription of a green fluorescent protein (GFP)-tagged bacterial-chromosome dihydrofolate reductase (DHFR) transgene can be visualized in a living cell by using three-dimensional magnetic twisting cytometry to apply local stresses on the cell surface via an Arg-Gly-Asp-coated magnetic bead. Chromatin stretching depended on loading direction. DHFR transcription upregulation was sensitive to load direction and proportional to the magnitude of chromatin stretching. Disrupting filamentous actin or inhibiting actomyosin contraction abrogated or attenuated force-induced DHFR transcription, whereas activating endogenous contraction upregulated force-induced DHFR transcription. Our findings suggest that local stresses applied to integrins propagate from the tensed actin cytoskeleton to the LINC complex and then through lamina-chromatin interactions to directly stretch chromatin and upregulate transcription.


Conflict of interest statement

Conflict of Interest. The authors declare no conflict of interest.

Figures

Figure 1
Figure 1. Strategy of visualizing chromatin under force
(A) Schematic representation of transgene insertions and fluorescence labeling of chromatin in live cells (Not drawn to scale) . Two yellow lines represent the long sequence of BAC. A stable cell line of DHFR D10 clone was used that had an insertion of 10 copies of the BAC into the same chromatin domain without any intervening CHO (Chinese Hamster Ovary) genomic DNA. Here for visual simplicity only 2 copies of BAC (with DHFR gene and LacO) are drawn. (B) GFP tagged chromatin domains are shown inside the nucleus of a living CHO cell. Left image: nucleus is outlined by dashed lines; the brightfield image is overlaid with the fluorescent image. Right image: the magnified GFP-LacI image of the same cell; an arrow point to chromatin domains tagged with multiple GFP spots. (C) Schematic representation of the 3D Magnetic Twisting Cytometry (3D MTC). (D) A ferromagnetic bead was attached to the apical surface of the cells via integrins. A new strategy of altering stress angle but keeping stress amplitude constant was employed by which the bead was magnetized in Z direction and twisted in specified angles toward the X–Y plane by simultaneously modulating the amplitudes of the magnetic fields in X and Y directions. (E) A live CHO cell with a 4-μm ferromagnetic bead (a white arrow points to a solid black circle) with the GFP labeled chromatin (a yellow arrow points to the green spots). θ represents the angle of bead rotating direction with respect to the long axis of the cell (this notation applies to all cells in all figures). Scale bar, 5 μm. (F) Displacements of the center of the magnetic bead at the stress angle of θ=0º, 45º, or 90º in the same cell as in (E). Each displacement value is an average of data from 3 cycles. In all stress directions, the amplitudes of the sinusoidal magnetic fields (at 0.3 Hz) were modulated such that the peak stress amplitude remained constant at 15 Pa. The peak bead displacement was smaller along the long-axis of the cell than along the short axis. Note that due to a slight non-alignment between 0° stress angle (Y-axis) and the long axis of the cell in (D), thus 0° is in fact ~10°. Since the loading is cyclic and sinusoidal, a minus stress sign in (F) only represents the opposite direction of loading from the plus stress sign. (G) The dependence of cell stiffness (the ratio of the applied stress to the measured strain) on stress angles. Cell length to width ratio equals 2.84±0.377. Mean ± s.e.m.; n=30 cells, 21 independent experiments; *** P<0.001. (h) Schematic of two GFP spots of chromatin being deformed under stress. (i) Distance between two GFP spots (#1 and #2, corresponding to #2 and #3 GFP spots in Fig. 2d) in the same chromatin increases under a cyclic stress applied via integrins. Stress = 17.5 Pa at 0.3 Hz. Two white dashed lines are drawn only for visual aid.
Figure 2
Figure 2. The extent of chromatin stretching depends on stress directions
Mean Squared Displacement (MSD) of individual GFP spots #1 (a), #2 (b), and #3 (c) in a representative cell (the same cell as in Fig. 1e), when the stress (15 Pa at 0.3 Hz) was applied at 0º, 45º, or 90º. The black dashed lines in a, b, and c were the no stress control. It is apparent that the MSD was largest when the stress was applied along the transverse direction relative to the long axis of the cell. Data from 7 cycles of displacements are averaged in MSD curves. (d) The fluorescent image of the three GFP spots in the same chromatin of the cell. (e, f) Chromatin stretching (both peak stretching amplitude in (e) and % stretching in (f)) depends on stress angles. The increase of distance between any two GFP spots (Δ Distance) as a function of the stress angle at a constant peak stress (15 Pa at 0.3 Hz) represents the extent of chromatin stretching. Note that % stretching represents “an apparent stretching of the chromatin”, i.e., the distance between two spots on the chromatin is increased; it does not suggest that the chromatin molecule itself is stretched or elongated. The peak compressing amplitude and % compressing were similar to those of stretching. Mean ± s.e.m; n=90 GFP spots from 30 cells of 21 separate experiments; *** P<0.001.
Figure 3
Figure 3. Transcription increases with the extent of chromatin stretching
(a) A schematic of the process of Fluorescence in situ Hybridization (FISH) to quantify force-induced transcription at the location of transgene insertions with Cy3-conjugated mixed-probes (see Methods) to detect the expression of DHFR mRNA. Arrows represent stretching stress on the chromatin. (b) From the left, a brightfield image of a live CHO cell (its nucleus was highlighted with dashed lines) with a magnetic bead (black dot) (the white arrow represents the direction of the bead center displacement); middle left, GFP-LacI spots (green) were shown indicating the location of the transgene insertions; middle right, DHFR mRNA expression was quantified using Cy3-conjugated FISH probes (red); right, overlay of Cy3-FISH (red) with GFP-LacI (green) showing very close vicinity of the two. Stress was applied at 17.5 Pa at 0.3 Hz for 1 hour. Scale bar, 5 μm. (c) Summarized data of DHFR expression at transgene insertions as a function of the stress angles. Each cell was stressed only at one particular angle (this is the case for all FISH experiments). Controls (No Stress) were the cells in the same culture dish without attached magnetic beads so that they were exposed to the same magnetic field but no mechanical stress. The stress was applied for 1 hr at 0.3 Hz. Mean ± s.e.m.; n>50 cells per condition; *** P<0.001. (d) Gene upregulation depends on stress amplitudes. Ctrl, 0: cells in the same dish as those bound with beads (for plotting simplicity, all control cells data were lumped together). RGD, 0: cells bound with Arg-Gly-Asp peptides coated beads but no stress. PLL, 8.8 or PLL, 17.5: cells bound with poly-L-lysine coated magnetic beads (one bead per cell), applied with a 8.8-Pa or a 17.5-Pa stress. PLL+DMSO, 17.5: cells bound with PLL-beads, pretreated with 0.1% Dimethyl sulfoxide (DMSO) (a solvent for Latrunculin A (LatA)), applied with a 17.5-Pa stress. PLL+LatA, 17.5: cells bound with PLL-beads, pretreated with 1 μM LatA for 30 min, applied with a 17.5-Pa stress. RGD, 8.8 or RGD, 17.5: cells bound with RGD coated beads, applied with either an 8.8-Pa or a 17.5-Pa stress. All stresses were applied at 0.3 Hz for 1 hr. Mean ± s.e.m.; n=60 cells for Ctr, 0; 25 cells for RGD, 0; 33 cells for PLL, 8.8; 41 cells for PLL, 17.5; 19 cells for PLL+DMSO, 17.5; 26 cells for PLL+DMSO, 17.5; 43 cells for RGD, 8.8; and 31 for RGD, 17.5; 4 independent experiments. (e) Gene upregulation by stress depends on duration of stress application (17.5 Pa at 0.3 Hz). DHFR transcription increased in cells stressed via RGD-coated beads relative to controls. Mean ± s.e.m.; without stress: n=31, 32, and 30 cells at 15, 30, and 60 min, respectively; with stress: n=47, 30, and 31 cells at 15, 30, and 60 min, respectively. * P<0.05; *** P<0.001. Note that stress angles were lumped together in (d) and (e) for each condition.
Figure 4
Figure 4. Rapid initiation of force-induced gene transcription
(a) Normalized transcription when fluorescently-labeled 5′-end-probes were utilized to probe the first 1700 bps of the DHFR transcripts (see Methods). Mean±s.e.m.; at 2, 4, 6, 8, 10, 20, 30 min, n=31, 29, 26, 20, 16, 13, 23 cells for Control conditions (cells in the same dish but no bead and applied stress); n= 21, 15, 32, 28, 21, 23, and 29 cells for Force conditions (stress=17.5 Pa at 0.3 Hz); 3 separate experiments; * P<0.05; ** P<0.01; *** P<0.001; in all cases the stressed cells were compared with their control counterpart cells at the same time. No statistically significant differences were observed between 6 min force with 8 min force (p=0.0883), or between 8 min force and 10 min force (p=0.9785). (b) Normalized transcription when fluorescently-labeled 3′-end-probes were utilized to probe the last 2000 bps of the DHFR transcripts (see Methods). Mean±s.e.m.; at 2, 4, 6, 8, 10, 20, 30 min, n=24, 22, 33, 15, 15, 16, 18 cells for Control conditions (no stress); n= 13, 19, 15, 16, 21, 16, and 18 cells for Force conditions (stress=17.5 Pa at 0.3 Hz); 3 separate experiments; *** P<0.001; ns=not statistically significant. There were significant differences between 10 min force and 20 min force (p=0.0351); no statistically significant differences were observed between 20 min force and 30 min force (p=0.7163). (c) Early time upregulation of transcription. 5′-end-probes were used. No stress: cells in the same dish but without the beads (no stress). Stress: stress applied at 17.5 Pa and 0.3 Hz. Bead binding alone did not have any effect on DHFR transcription (when comparing cells with beads and cells without beads). Mean±s.e.m.; at 5, 10, 15, 30, 60, 90, 120 sec, n=35, 25, 50, 56, 43, 44, and 45 cells for No stress; n=36, 37, 69, 59, 71, 51, and 61 cells for Stress conditions; three separate experiments. (d) Early time transcription is stress angle dependent. 5′-end-probes were used. Mean ± s.e.m.; at 5, 10, 15, 30, 60, 90, 120 sec, n=11, 15, 24, 20, 24, 27, 14 for 0°–30°, n=12, 11, 27, 22, 25, 22, 19 for 30°–60°, n=13, 11, 18, 17, 22, 12, 18 for 60°–90°, respectively. For (c and d); three separate experiments; * P<0.05, ** P<0.01, *** P<0.001; ns=not statistically significant. For simplicity, controls (No stress) data that are shown in (c) are not re-plotted in (d) and are only represented with a dashed line. All data in (d) at various stress angles 15 sec or more after stress application are significantly higher than No stress conditions (all P<0.001). Dashed lines in (a, b, d) are only for visual aid.
Figure 5
Figure 5. Structural basis of force transfer to stretch chromatin
(a) Summarized data of quantification of the mean (frame-to-frame; 300 ms per frame) chromatin spontaneous movements without externally applied forces. All conditions were normalized to Neg Ctr; those that were treated with scrambled siRNA. Mean ± s.e.m.; n=36 (Control baseline movements=20.97±1.04 nm), 61 (Lmnb1/2, both Lmnb1 and Lmnb2 were silenced), 44 (cbx1/5, both cbx1 and cbx5 were silenced), 37 (Lmna), 56 (Emd), 41 (Banf1), 48 (SUN1/2, both SUN1 and SUN2 were silenced), 35 (LBR) cells, respectively; 3 separate experiments. * P<0.05; ** P<0.01; *** P<0.001. The red dashed line is drawn for visual aid only. (b) HP1 and BAF proteins, in addition to lamin A, lamin B, Emerin, and SUN1/2, transmit stresses from Lamins to chromatins. Lmnb1 and 2, Lmna, Emd, Banf1, HP1 (Cbx1 and 5), SUN1/2, and LBR genes were silenced using siRNA and local oscillatory forces are applied to the cell surface using MTC (8.8 Pa at 0.3 Hz). Force-induced displacements of GFP-LacI labeled chromatin transgenes were measured. Neg Ctr: force-induced displacements after scrambled siRNA treatment. Mean ± s.e.m.; n=10, 9, 9, 5, 10, 5, 28, 26 cells for Neg Ctr, Lmnb1&2, Cbx1&5, Lmna, Emd, and Banf1, SUN1/2, and LBR respectively; 3 separate experiments; * P<0.05; ** P<0.01; *** P<0.001; ns=not statistically significant. (c) Summarized data for normalized DHFR transcription after knocking down individual nuclear proteins. Stress was applied at 17.5 Pa at 0.3 Hz for 2 min to CHO cells bound with RGD-coated magnetic beads. DHFR partial transcripts were detected using 5′-probes and FISH. No stress: cells in the same dish but no stress was applied. Neg Ctr: treated with scrambled siRNA. Mean±s.e.m.; n=49, 19, 25, 19, 26, 27, 25, and 19 cells for Neg Ctr, Lmnb1/2, Cbx1/5, Lmna, Emd, Banf1, SUN1/2, and LBR silenced conditions under no stress; n=49, 18, 18, 17, 31, 32, 24, and 30, respectively for the corresponding conditions with applied stress. 3 separate experiments. ** P<0.01; *** P<0.001; ns=not statistically significant. Red dashed line is for visual aid only. (d) Summarized data for contour length (length of the line connecting GFP spots) and the number of GFP spots (number of active transgenes) without (Control) and with Y-27632 (20 μM for 30 min) or LPA (with 2 μgml−1 for 60 min) treatment. Y-27632 treated cells had shorter contour lengths and hence fewer GFP spots, indicating that the chromatin is more condensed; LPA treated cells exhibited opposite phenotypes, suggesting that the chromatin is more decondensed. Mean ± s.e.m.; n=48, 26, 28 cells (contour lengths and GFP spots) for Control, Y-27632, and LPA conditions, respectively; 3 separate experiments. * P<0.05; *** P<0.001. (e) Gene regulation by stress depends on actomyosin tension. Stress was applied via RGD-coated beads. Control: untreated cells stressed at 17.5 Pa and 0.3 Hz for 60 min; Y-27632: cells pretreated with 20 μM Y-27632 for 30 min before stress was applied for 60 min; LPA: cells pretreated with 2 μgml−1 LPA for 60 min before stress was applied for 60 min, Mean ± s.e.m.; n=31, 28, 53 cells for Control, Y-27632, and LPA conditions, respectively; n=3 separate experiments; ** P<0.01; *** P<0.001.
Figure 6
Figure 6. A model for direct force impact on gene activation
A local surface force via integrins is propagated though the myosin-II tensed actin cytoskeleton to the LINC (via SUN1 and SUN2) complex, to nuclear lamins, and then is transferred to the flanking chromatin through BAF and HP1 proteins and other molecules. The flanking chromatin transfers the force to deform and to stretch the chromatin segment containing the DHFR gene at the nuclear interior, facilitating binding of the RNA Polymerase II and transcription factors to upregulate DHFR transcription. Note that underneath each nuclear protein is its gene name. Not drawn to scale.

Comment in

References

    1. Discher DE, Mooney DJ, Zandstra PW. Growth factors, matrices, and forces combine and control stem cells. Science. 2009;324:1673–1677. - PMC - PubMed
    1. Vogel V, Sheetz M. Local force and geometry sensing regulate cell functions. Nat Rev Mol Cell Biol. 2006;7:265–275. - PubMed
    1. Friedland JC, Lee MH, Boettiger D. Mechanically activated integrin switch controls alpha5beta1 function. Science. 2009;323:642–644. - PubMed
    1. del Rio A, et al. Stretching single talin rod molecules activates vinculin binding. Science. 2009;323:638–641. - PMC - PubMed
    1. Grashoff C, et al. Measuring mechanical tension across vinculin reveals regulation of focal adhesion dynamics. Nature. 2010;466:263–266. - PMC - PubMed

Publication types