Resting-state test-retest reliability of a priori defined canonical networks over different preprocessing steps
- PMID: 27550015
- PMCID: PMC5322256
- DOI: 10.1007/s00429-016-1286-x
Resting-state test-retest reliability of a priori defined canonical networks over different preprocessing steps
Abstract
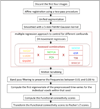
Resting-state functional connectivity analysis has become a widely used method for the investigation of human brain connectivity and pathology. The measurement of neuronal activity by functional MRI, however, is impeded by various nuisance signals that reduce the stability of functional connectivity. Several methods exist to address this predicament, but little consensus has yet been reached on the most appropriate approach. Given the crucial importance of reliability for the development of clinical applications, we here investigated the effect of various confound removal approaches on the test-retest reliability of functional-connectivity estimates in two previously defined functional brain networks. Our results showed that gray matter masking improved the reliability of connectivity estimates, whereas denoising based on principal components analysis reduced it. We additionally observed that refraining from using any correction for global signals provided the best test-retest reliability, but failed to reproduce anti-correlations between what have been previously described as antagonistic networks. This suggests that improved reliability can come at the expense of potentially poorer biological validity. Consistent with this, we observed that reliability was proportional to the retained variance, which presumably included structured noise, such as reliable nuisance signals (for instance, noise induced by cardiac processes). We conclude that compromises are necessary between maximizing test-retest reliability and removing variance that may be attributable to non-neuronal sources.
Keywords: Confound removal; Reliability; Resting-state functional connectivity; Test–retest; fMRI.
Conflict of interest statement
The authors declare that the research was conducted in the absence of any commercial or financial relationships that could be construed as a potential conflict of interest.
Figures


Similar articles
-
Test-retest reliability of functional connectivity networks during naturalistic fMRI paradigms.Hum Brain Mapp. 2017 Apr;38(4):2226-2241. doi: 10.1002/hbm.23517. Epub 2017 Jan 17. Hum Brain Mapp. 2017. PMID: 28094464 Free PMC article.
-
Is Rest Really Rest? Resting-State Functional Connectivity During Rest and Motor Task Paradigms.Brain Connect. 2018 Jun;8(5):268-275. doi: 10.1089/brain.2017.0495. Brain Connect. 2018. PMID: 29665711
-
Test-retest reliability of dynamic functional connectivity in naturalistic paradigm functional magnetic resonance imaging.Hum Brain Mapp. 2022 Mar;43(4):1463-1476. doi: 10.1002/hbm.25736. Epub 2021 Dec 6. Hum Brain Mapp. 2022. PMID: 34870361 Free PMC article.
-
A decade of test-retest reliability of functional connectivity: A systematic review and meta-analysis.Neuroimage. 2019 Dec;203:116157. doi: 10.1016/j.neuroimage.2019.116157. Epub 2019 Sep 5. Neuroimage. 2019. PMID: 31494250 Free PMC article.
-
Test-retest reliabilities of resting-state FMRI measurements in human brain functional connectomics: a systems neuroscience perspective.Neurosci Biobehav Rev. 2014 Sep;45:100-18. doi: 10.1016/j.neubiorev.2014.05.009. Epub 2014 May 27. Neurosci Biobehav Rev. 2014. PMID: 24875392 Review.
Cited by
-
Whole-brain dynamical modelling for classification of Parkinson's disease.Brain Commun. 2022 Dec 15;5(1):fcac331. doi: 10.1093/braincomms/fcac331. eCollection 2023. Brain Commun. 2022. PMID: 36601625 Free PMC article.
-
Challenges in measuring individual differences in functional connectivity using fMRI: The case of healthy aging.Hum Brain Mapp. 2017 Aug;38(8):4125-4156. doi: 10.1002/hbm.23653. Epub 2017 May 23. Hum Brain Mapp. 2017. PMID: 28544076 Free PMC article.
-
Intrinsic Connectivity Patterns of Task-Defined Brain Networks Allow Individual Prediction of Cognitive Symptom Dimension of Schizophrenia and Are Linked to Molecular Architecture.Biol Psychiatry. 2021 Feb 1;89(3):308-319. doi: 10.1016/j.biopsych.2020.09.024. Epub 2020 Oct 3. Biol Psychiatry. 2021. PMID: 33357631 Free PMC article.
-
An examination of the reliability of seed-to-seed resting state functional connectivity in tinnitus patients.Neuroimage Rep. 2023 Feb 15;3(1):100158. doi: 10.1016/j.ynirp.2023.100158. eCollection 2023 Mar. Neuroimage Rep. 2023. PMID: 40568052 Free PMC article.
-
A Complex Interplay of Vitamin B1 and B6 Metabolism with Cognition, Brain Structure, and Functional Connectivity in Older Adults.Front Neurosci. 2017 Oct 27;11:596. doi: 10.3389/fnins.2017.00596. eCollection 2017. Front Neurosci. 2017. PMID: 29163003 Free PMC article.
References
Publication types
MeSH terms
Substances
Grants and funding
LinkOut - more resources
Full Text Sources
Other Literature Sources

