Clinical Trial
. 2016 Dec;17(6):559-575.
doi: 10.1007/s10162-016-0574-8. Epub 2016 Aug 22.

Effect of Contralateral Medial Olivocochlear Feedback on Perceptual Estimates of Cochlear Gain and Compression

Affiliations
Clinical Trial

Effect of Contralateral Medial Olivocochlear Feedback on Perceptual Estimates of Cochlear Gain and Compression

Mark D Fletcher et al. J Assoc Res Otolaryngol. 2016 Dec.

Abstract

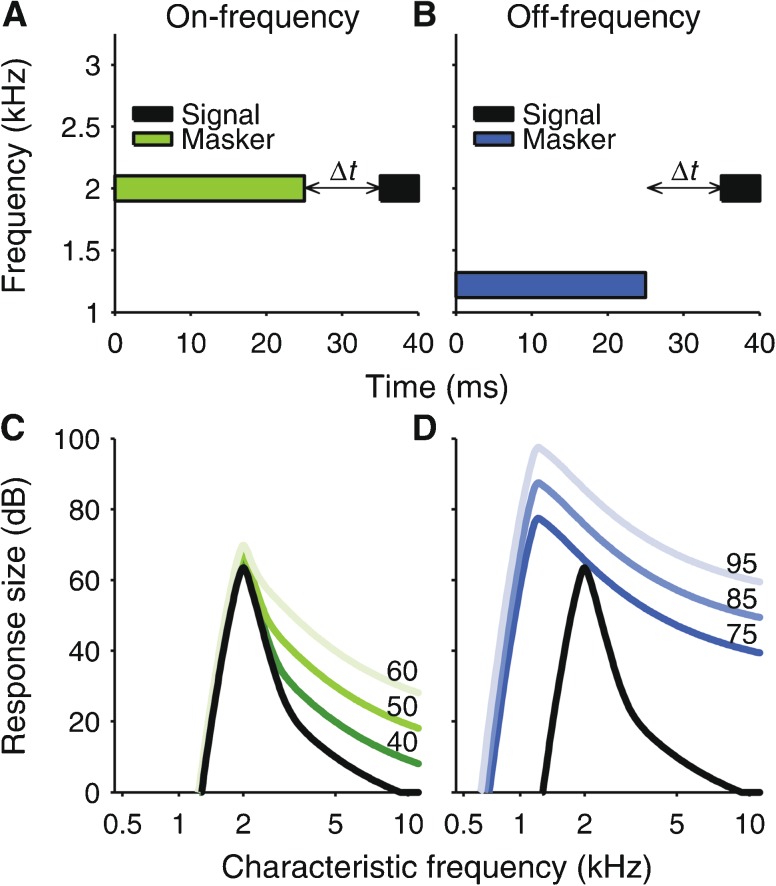
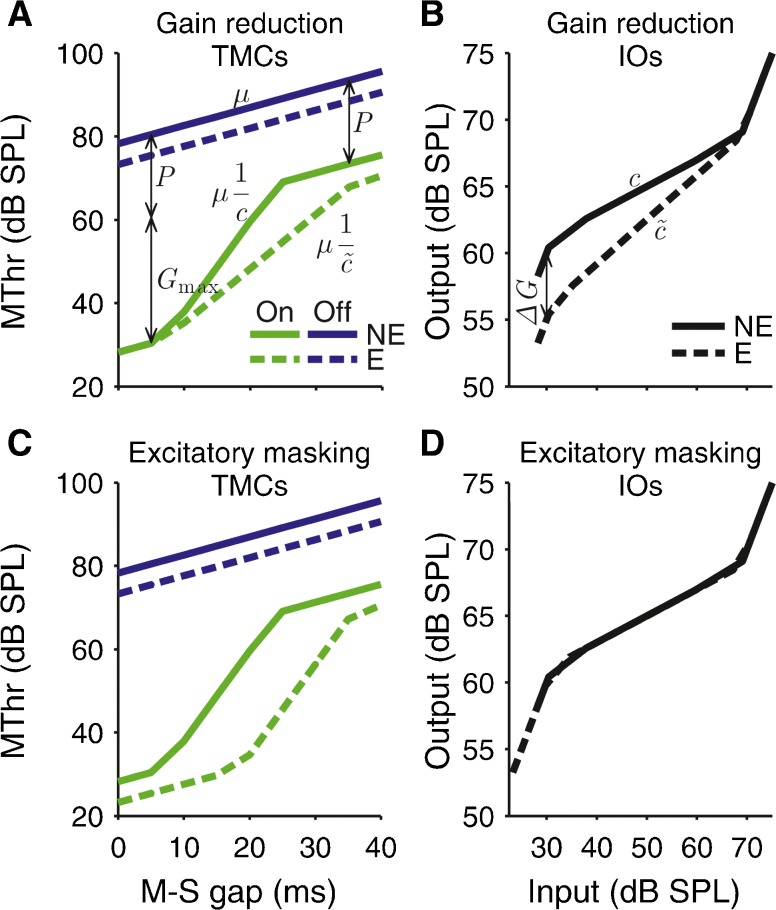
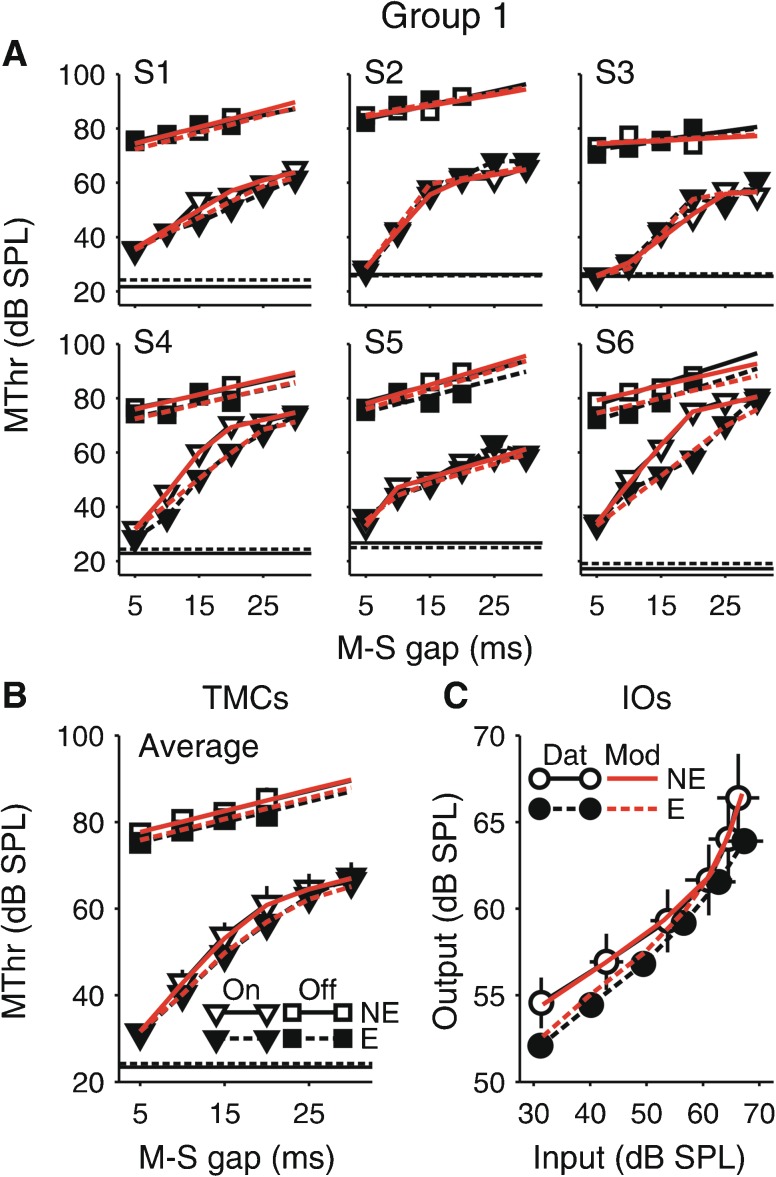
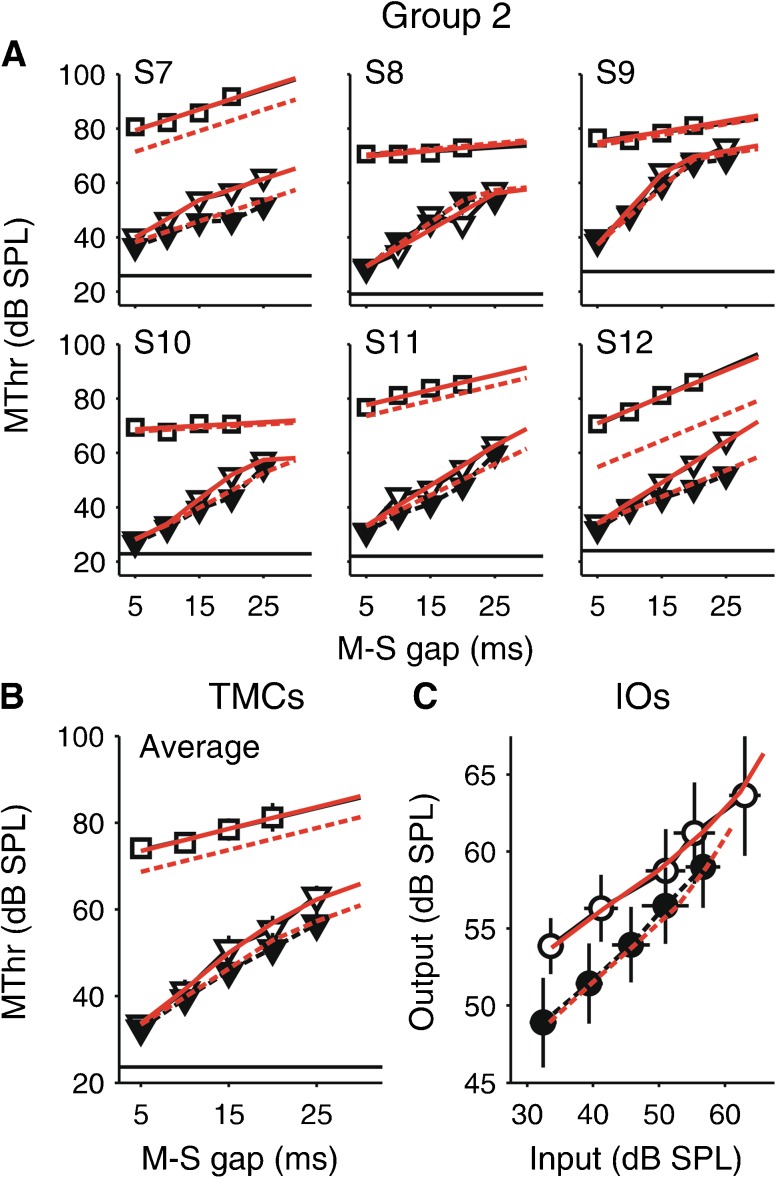
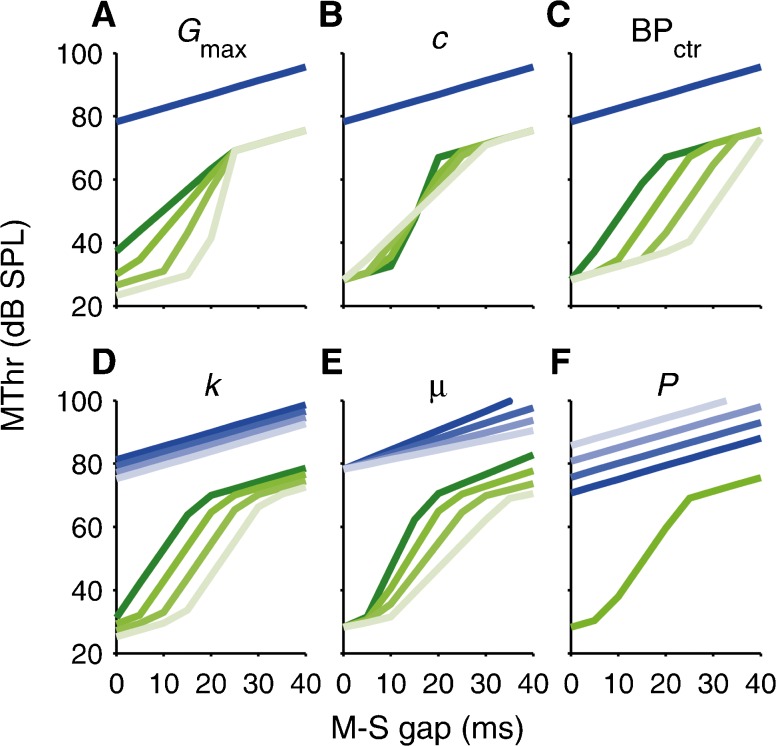
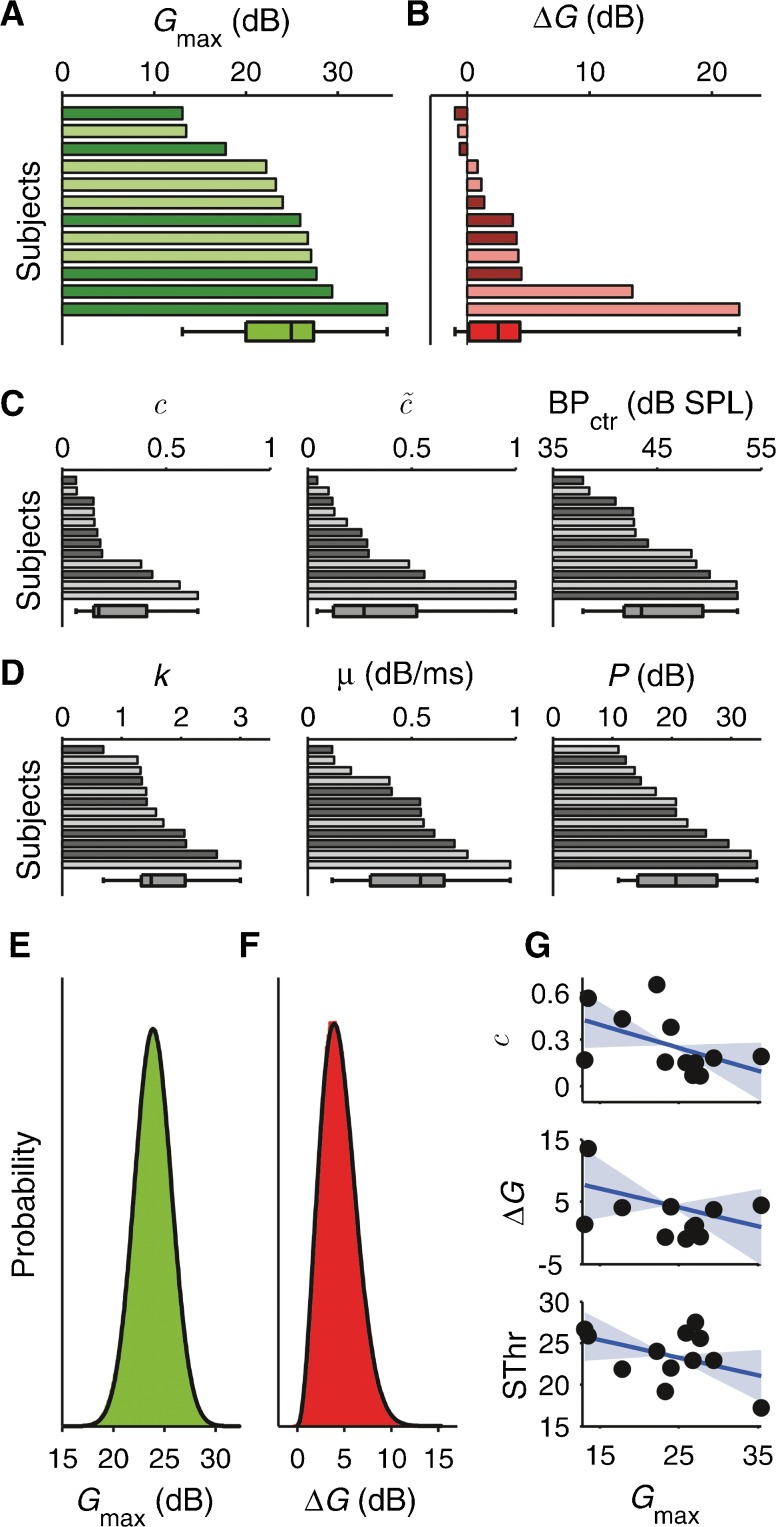
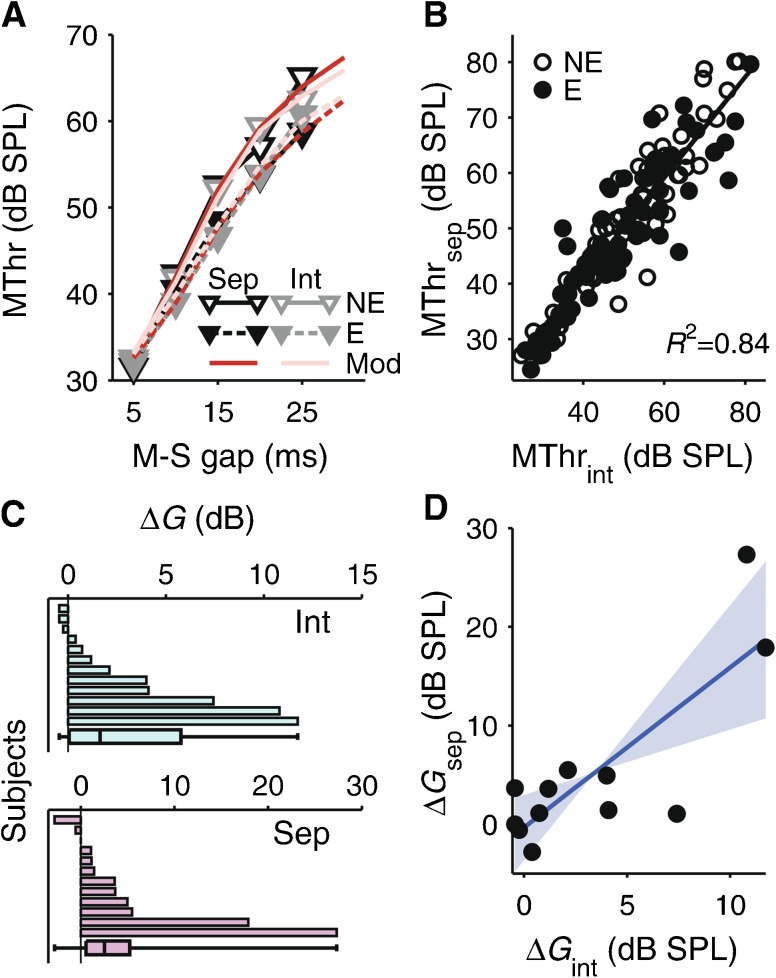
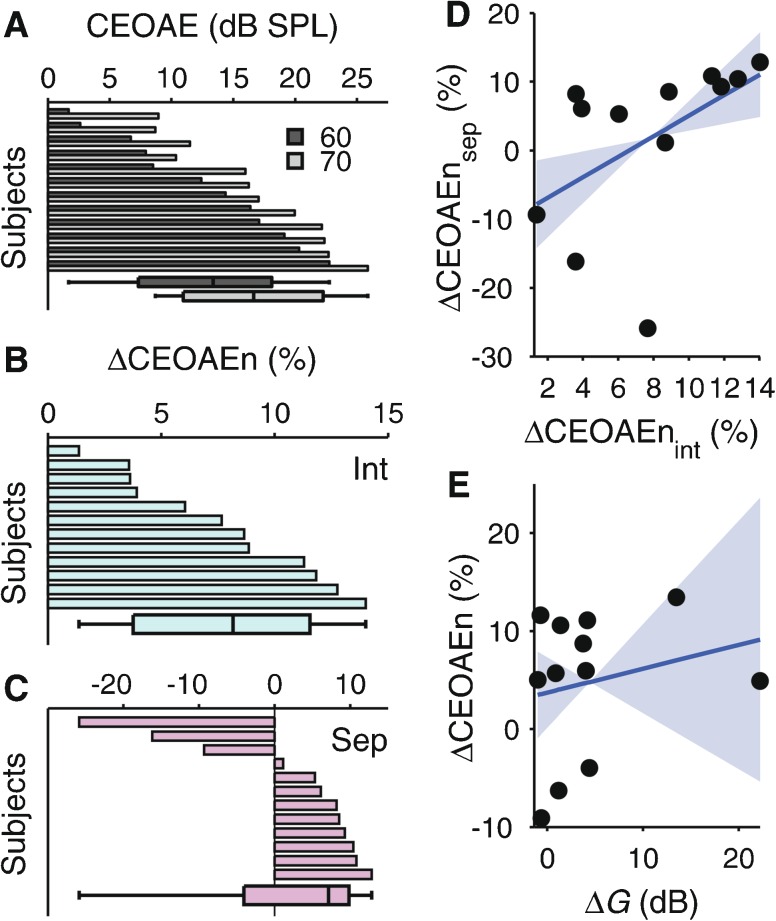
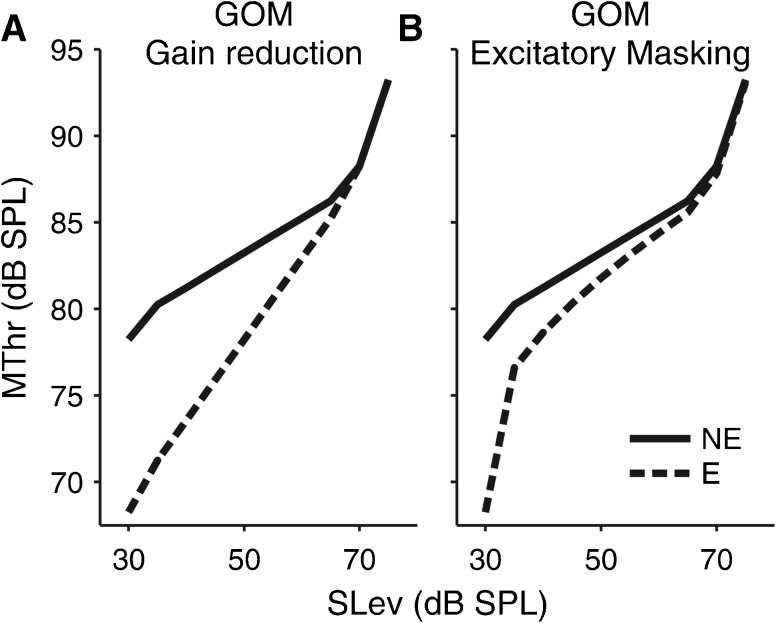
The active cochlear mechanism amplifies responses to low-intensity sounds, compresses the range of input sound intensities to a smaller output range, and increases cochlear frequency selectivity. The gain of the active mechanism can be modulated by the medial olivocochlear (MOC) efferent system, creating the possibility of top-down control at the earliest level of auditory processing. In humans, MOC function has mostly been measured by the suppression of otoacoustic emissions (OAEs), typically as a result of MOC activation by a contralateral elicitor sound. The exact relationship between OAE suppression and cochlear gain reduction, however, remains unclear. Here, we measured the effect of a contralateral MOC elicitor on perceptual estimates of cochlear gain and compression, obtained using the established temporal masking curve (TMC) method. The measurements were taken at a signal frequency of 2 kHz and compared with measurements of click-evoked OAE suppression. The elicitor was a broadband noise, set to a sound pressure level of 54 dB to avoid triggering the middle ear muscle reflex. Despite its low level, the elicitor had a significant effect on the TMCs, consistent with a reduction in cochlear gain. The amount of gain reduction was estimated as 4.4 dB on average, corresponding to around 18 % of the without-elicitor gain. As a result, the compression exponent increased from 0.18 to 0.27.

Keywords: click-evoked otoacoustic emissions (CEOAEs); cochlear amplification; contralateral acoustic stimulation; medial olivocochlear reflex (MOCR); temporal masking curve (TMC).


Figures

FIG. 1
FIG. 1
A, B Schematic representation of spectral and temporal stimulus characteristics for on- (A) and off-frequency (B) temporal masking curve (TMC) measurements. Δt: masker-signal gap. C, D Cochlear response patterns (“excitation patterns”) of the signal (black line) and the on- and off-frequency maskers (green- and blue-shaded lines in panels C and D, respectively). The patterns were calculated by modeling the cochlear filters as two rounded exponential functions (Patterson and Nimmo-Smith 1980), one representing the active tip filter and the other to the passive tail filter. The tip filters had an equivalent rectangular bandwidth (ERB) of ERBn = 24.67 ⋅ (4.37 ⋅ CF + 1) Hz, where CF is the characteristic frequency in kilohertz (Glasberg and Moore 1990), and were centered at CF. The tail filters were centered a quarter octave below CF and their ERB was equal to 3 ⋅ ERBn. The tip filters had a gain of G(L) = max(min((c − 1) ⋅ (L − BP 1) + G max, G max), 0), where L is the stimulus level, and c and BP1 are the compression exponent and lower edge of the compressive range of the tip response IO function, respectively (equal to 0.2 and 28.125 dB SPL in this simulation). The tail filters had zero gain. The signal was set to a level of 30 dB SPL (similar to the average signal level in the current experiment). The maskers were set to three different levels (shown in dB SPL to the right of the patterns).
FIG. 2
FIG. 2
A, C Simulated on- and off-frequency TMCs (green and blue lines) without (solid lines) and with (dashed lines) an elicitor (labelled NE and E; see legend in A). For A, the elicitor was assumed to cause a reduction in cochlear gain, and for C, it was assumed to cause direct excitatory masking. Panels B and D show the respective inferred cochlear input-output (IO) functions (off- versus on-frequency masking thresholds minus passive attenuation of the off-frequency masker response, P). G max, c: maximum gain and compression exponent without the elicitor; ΔG, c˜: elicitor-induced gain reduction and with-elicitor compression exponent; μ: decay rate of masker effect.
FIG. 3
FIG. 3
TMC results for the first group of subjects (S1–S6), who were tested in both the on- and off-frequency conditions with and without the elicitor. A, B Individual and average TMCs as a function of masker-signal gap (M-S gap), and C average inferred IO function. The data are shown in black (Dat). The red lines (Mod) show model fits explained in a later section (“Cochlear IO Function Model” section). The on- and off-frequency masking thresholds (On, Off) are shown by triangles and squares, respectively. The without-elicitor TMCs (NE) are shown by open symbols and solid lines and the with-elicitor TMCs (E) by closed symbols and dashed lines (legends in B and C). The IO functions in panel C were constructed by plotting the off-frequency masking threshold for each masker-signal gap against the corresponding on-frequency threshold and correcting for the passive difference between the on- and off-frequency masker responses at the signal place (P; derived from the cochlear IO function model fits). The error bars in panels B and C show the standard error of the mean (SEM).
FIG. 4
FIG. 4
TMC results for the second group of subjects (S7–S12), plotted in the same way as the results for the first group (Fig. 3). In the second group, the off-frequency TMC was measured only without the elicitor. The with-elicitor IO function in panel C was constructed using the predicted off-frequency TMCs based on the cochlear IO function model fits (linear red dashed lines in panels A and B).
FIG. 5
FIG. 5
Effect on TMCs of variation in each model parameter (maximum cochlear gain, G max, compression exponent, c, center of compressive range, BPctr, threshold signal-to-masker ratio, k, masker effect decay rate, μ, and passive attenuation, P). For each panel, each parameter was varied separately. When varying G max (A), the compressive range (defined by the break points, BP1 and BP2) was kept fixed, and so the compression exponent, c, had to co-vary. When varying c (B), G max was kept fixed, and so the compressive range had to co-vary.
FIG. 6
FIG. 6
AD Individual best-fitting model parameters, G max (maximum without-elicitor gain; A), ΔG (elicitor-induced gain reduction; B), c (without-elicitor compression exponent; C, left), c˜ (with-elicitor compression exponent; C, middle), BPctr (center of compressive range; C, right), k (threshold signal-to-masker ratio; D, left), μ (decay rate of masker effect; D, center), and P (passive attenuation; D, right). The parameters were sorted for size (independently in each panel). The bar and whiskers at the bottom of each panel show the median, 25th and 75th percentile, and minimum and maximum parameter values. The darker-shaded bars are the results of the first group of subjects (S1–S6; see Fig. 3), and the lighter-shaded bars are the results for the second group (S7–S12; see Fig. 4) (E, F). Bootstrap distributions of G max and ΔG (green and red; based on all possible 2N1N bootstrap resamples, where N = 12 is the number of subjects). The black lines show the best-fitting probability density functions. G Across-subject relationships between G max and c (top), G max and ΔG (middle), and G max and the signal quiet threshold (SThr) in dB SPL. The blue solid lines are the regression lines. The light-blue highlight shows the bootstrap confidence intervals of the regression slopes (again, based on all possible 2N1N resamples).
FIG. 7
FIG. 7
A Comparison between on-frequency TMCs measured in the separate and interleaved sessions. The TMCs from the separate sessions (Sep) are shown in black and those from the interleaved sessions (Int) in gray. The corresponding model fits (Mod) are shown by darker- and lighter-red lines. The without-elicitor TMCs (NE) are shown by open symbols and solid lines and the with-elicitor TMCs (E) by closed symbols and dashed lines (legend). B Relationship between the masking thresholds from the interleaved and separate sessions (MThrint, MThrsep). The open circles show the without-elicitor and the filled circles the with-elicitor, thresholds (legend). The solid line is the regression line. R 2 is the squared Pearson correlation coefficient. C Individual elicitor-induced gain reductions, ΔG, for the interleaved (top) and separate (bottom) sessions, sorted by size (independently, as before). The bar and whiskers at the bottom of each panel show the median, percentiles, and absolute range as in Figure 6. D Across-subject relationship between ΔG for the interleaved and separate sessions (denoted ΔG int and ΔG sep). The blue solid line is the regression line, and the light-blue highlight shows the bootstrap confidence interval of the regression slope as in Figure 6.
FIG. 8
FIG. 8
A Individual without-elicitor CEOAE amplitudes for the 60- and 70-dB pe SPL click levels (dark- and light-gray bars), sorted in order of the size of the CEOAE amplitudes for the 60-dB pe SPL clicks. B, C Individual normalized CEOAE suppression indices, ΔCEOAEn (Mishra and Lutman ; negative values of ΔCEOAEn denote elicitor-induced CEOAE enhancement), for the interleaved (B) and separate (C) sessions, sorted for size (independently). The bars and whiskers at the bottom of each panel show the respective medians, percentiles, and absolute ranges as in the previous figures. D Across-subject relationship between ΔCEOAEn for the interleaved and separate sessions. E Across-subject relationship between the elicitor-induced gain reductions, ΔG, estimated from the TMCs, and ΔCEOAEn, averaged across sessions. The blue, solid lines show the regressions lines and the light-blue highlight the bootstrap confidence intervals of the regression slopes.
FIG. 9
FIG. 9
Predicted effects of elicitor-induced gain reduction (A) and direct excitatory masking on the off-frequency growth of masking (GOM) function. The solid lines show the without-elicitor functions (NE) and the dashed lines the with-elicitor functions (E; legend in B). The gain reduction and masking effects were set to cause the same amount of change in masking threshold (MThr) at the lowest signal level (SLev). The GOM functions were modelled using the same cochlear IO function model as used to model the TMCs shown in Figure 2 (G max = 30 dB, c = 0.2, BP1 = 28.125 dB SPL, k = 1.5, and P = 20 dB).

Similar articles

Cited by

References

    1. Aguilar E, Eustaquio-Martin A, Lopez-Poveda EA. Contralateral efferent reflex effects on threshold and suprathreshold psychoacoustical tuning curves at low and high frequencies. J Assoc Res Otolaryngol. 2013;14:341–357. doi: 10.1007/s10162-013-0373-4. - DOI - PMC - PubMed
    1. Aguilar E, Johannesen PT, Lopez-Poveda EA. Contralateral efferent suppression of human hearing sensitivity. Front Syst Neurosci. 2015;8:251. doi: 10.3389/fnsys.2014.00251. - DOI - PMC - PubMed
    1. Bacon SP, Moore BC. Transient masking and the temporal course of simultaneous tone‐on‐tone masking. J Acoust Soc Am. 1987;81:1073–1077. doi: 10.1121/1.395125. - DOI - PubMed
    1. Bacon SP, Liu L. Effects of ipsilateral and contralateral precursors on overshoot. J Acoust Soc Am. 2000;108:1811–1818. doi: 10.1121/1.1290246. - DOI - PubMed
    1. Bacon SP, Healy EW. Effects of ipsilateral and contralateral precursors on the temporal effect in simultaneous masking with pure tones. J Acoust Soc Am. 2000;107:1589–1597. doi: 10.1121/1.428443. - DOI - PubMed

Publication types

LinkOut - more resources