. 2016 Aug 23:7:12552.
doi: 10.1038/ncomms12552.

Hybrid bio-photo-electro-chemical cells for solar water splitting

Affiliations

Hybrid bio-photo-electro-chemical cells for solar water splitting

Roy I Pinhassi et al. Nat Commun. .

Abstract

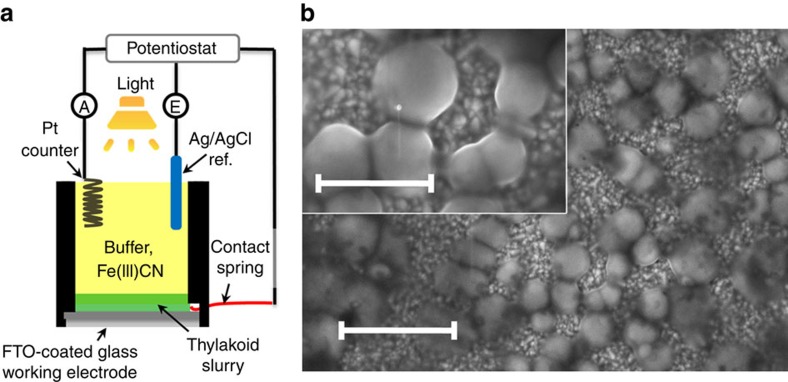
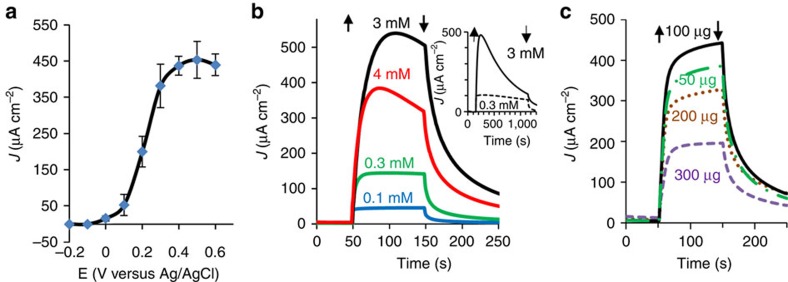
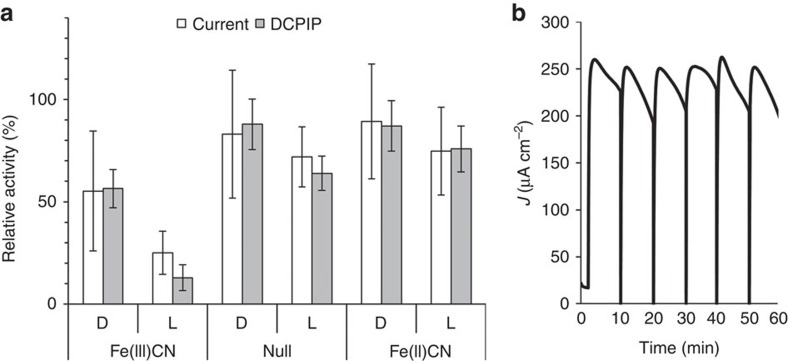
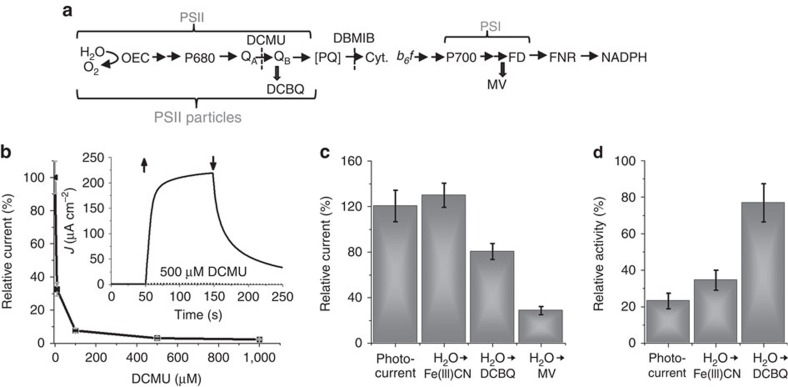
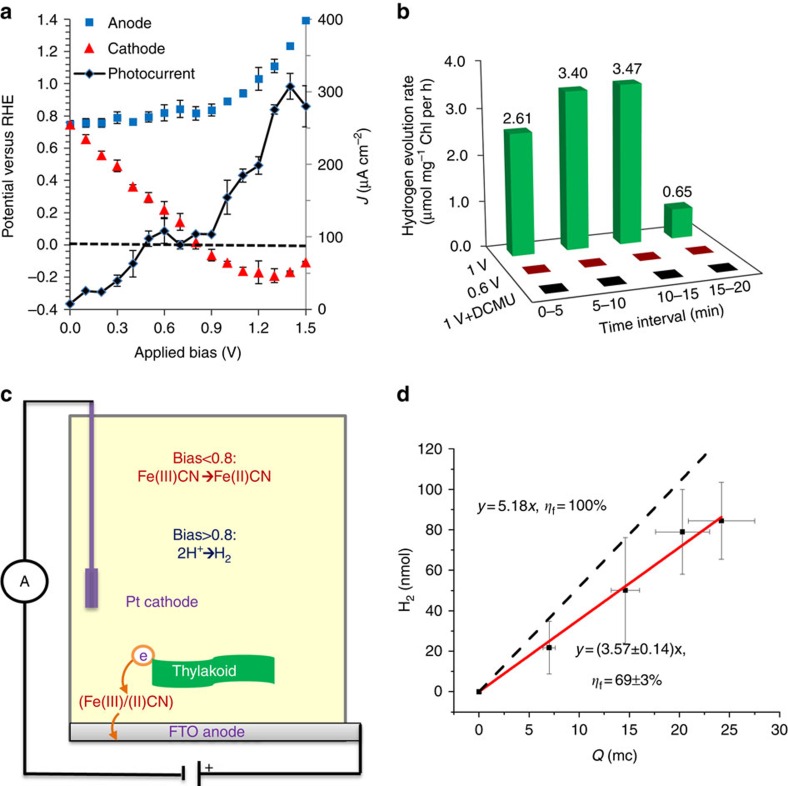
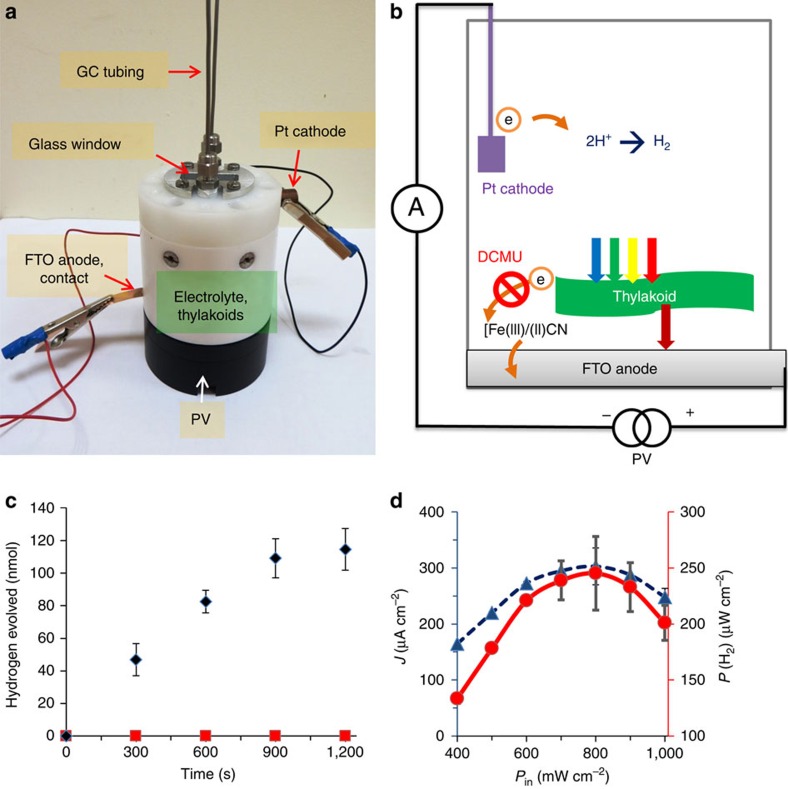
Photoelectrochemical water splitting uses solar power to decompose water to hydrogen and oxygen. Here we show how the photocatalytic activity of thylakoid membranes leads to overall water splitting in a bio-photo-electro-chemical (BPEC) cell via a simple process. Thylakoids extracted from spinach are introduced into a BPEC cell containing buffer solution with ferricyanide. Upon solar-simulated illumination, water oxidation takes place and electrons are shuttled by the ferri/ferrocyanide redox couple from the thylakoids to a transparent electrode serving as the anode, yielding a photocurrent density of 0.5 mA cm(-2). Hydrogen evolution occurs at the cathode at a bias as low as 0.8 V. A tandem cell comprising the BPEC cell and a Si photovoltaic module achieves overall water splitting with solar to hydrogen efficiency of 0.3%. These results demonstrate the promise of combining natural photosynthetic membranes and man-made photovoltaic cells in order to convert solar power into hydrogen fuel.


Figures

Figure 1
Figure 1. The BPEC cell.
(a) Schematic illustration of the BPEC cell. The cell comprises a cylindrical container with a window at the bottom, where a transparent working electrode (FTO coated glass) serving as the anode is sealed against a rubber gasket. The anode is electrically connected through a contact spring to a potentiostat, which is set in three-electrode mode (except for the two-electrode measurements described towards the end of the article), along with an Ag/AgCl reference electrode and a Pt counter electrode (that is, cathode). The potentiostat measures the current between the working and counter electrodes using an ammeter {A}, and the potential {E} of the working electrode with respect to that of the reference electrode. A minimal amount of thylakoids settles from a slurry of crude spinach thylakoids in buffer solution containing glycerol onto the exposed area (1.08 cm2) of the FTO anode. The cell cavity is filled with 20 ml buffer A solution, containing the redox mediator Fe(III)CN (K3Fe(CN)6), which serves as a recyclable electron shuttle between the thylakoids and the anode. (b) Scanning electron microscopy image of the spinach membranes on the surface of a FTO coated glass electrode. Small amount of membranes were placed on the electrode and the scanning electron microscopy images were taken in vacuum. Scale bar, 2 μm. Inset: scanning electron microscopy image at higher magnification. Scale bar, 1 μm.
Figure 2
Figure 2. Photocurrent measurements in three-electrode mode.
(a) Photocurrent density as a function of the electrode potential, measured in buffer A solution with a thylakoid content of 0.1 mg Chl and Fe(III)CN concentration of 3 mM. The error bars represent the s.d. over four independent measurements. (b) The photocurrent, measured at an electrode potential of 0.5 VAg/AgCl, as a function of time during exposure to solar-simulated light between t=50 and 150 s. Four measurements in buffer A solution with a thylakoid content of 0.1 mg Chl and Fe(III)CN concentrations of 0.1, 0.3, 3 and 4 mM are presented (blue, green, black and red curves, respectively). The inset shows the long-term photocurrent stability in high (3 mM, full line) and low (0.3 mM, dashed line) Fe(III)CN concentrations. The arrows indicate light turn on (up) and off (down) points. (c) The photocurrent dependence on the amount of thylakoids (expressed in mg Chl) in solution. Maximal photocurrent was obtained with 100 μg Chl (black line), whereas 50, 200 or 300 μg Chl (green broken, brown dotted or purple dashed lines, respectively) yielded lower currents. The measurements were carried out in buffer A solution with 3 mM Fe(III)CN.
Figure 3
Figure 3. Light-induced reduction of Fe(III)CN damages the photosynthetic activity of the thylakoids.
(a) The residual photocurrent and DCPIP reduction obtained from thylakoids after incubation for 10 min in the dark (D) or in light (L), without (null) or with 3 mM Fe(III)CN or Fe(II)CN, normalized to a control experiment using identical thylakoids without incubation. The error bars represent the s.d. over five measurements. (b) Batch mode of operation wherein damaged thylakoids were replaced with fresh ones every 10 min. All the other cell components were reused.
Figure 4
Figure 4. The photosynthetic electrons are extracted by Fe(III)CN following the QB site.
(a) A scheme of the photosynthetic electron flow (horizontal arrows) with exogenous electron acceptors (vertical arrows) and electron flow inhibitors (vertical dashed lines). Double arrows mark additional electron acceptors. (b) Relative photocurrent of thylakoids, measured at a potential of 0.5 VAg/AgCl with 3 mM Fe(III)CN, as a function of DCMU concentration, averaged over at least three experiments. The relative photocurrent is the photocurrent measured with DCMU divided by the photocurrent measured without it, as shown in the inset. (c) Relative photoactivity measured with DBMIB (5 μM) with respect to measurements without DBMIB. The columns show (left to right) the relative photocurrent and oxygen evolution rates measured with Fe(III)CN or DCBQ as acceptors and the oxygen consumption rate using MV as electron acceptor. The results error bars represent the s.d. over at least three measurements. (d) Relative photocurrent and photoactivity of Fe(III)CN and DCBQ reduction rates in PSII particles, relative to the respective measurements with intact thylakoids (both at the equivalent amount of 0.1 mg Chl). It is noted that when measured at the equivalent amount of lower chlorophyll concentration such as 0.01 mg Chl, the H2O to DCBQ activity of the PSII particles was higher than that of intact thylakoids. The error bars represent the s.d. over at least three measurements.
Figure 5
Figure 5. Quantum efficiency.
The quantum efficiency, that is, the photo induced electrons per photons, measured at various wavelengths from 440 to 720 nm with a spectral bandwidth of 10 nm. Measurements were taken with different samples of thylakoids (0.1 mg Chl) for each wavelength. The photocurrent was measured at a potential of 0.5 VAg/AgCl. The values error bars represent the s.d. over three measurements.
Figure 6
Figure 6. Two-electrode mode measurements.
(a) Photocurrent (black curve) and anode (blue squares) and cathode (red triangles) potentials as a function of the applied bias between the anode and cathode. The dashed line represents a potential of 0 VRHE. The photocurrent was measured under exposure to solar-simulated light in a cell containing buffer A solution with a thylakoid content of 0.1 mg Chl and Fe(III)CN concentration of 3 mM. The error bars represent the s.d. over three independent measurements (b) Hydrogen evolution rate at the cathode under a bias of 0.6 V (red bars), 1.0 V (green bars) and 1.0 V with the addition of 0.5 mM DCMU. (c) Schematic illustration of the proposed electron transfer pathway in the BPEC cell. When the applied bias is lower than 0.8 V the cathode reaction is dominated by cyclic electron transfer of the Fe(III)CN/Fe(II)CN couple, whereas above 0.8 V proton reduction to hydrogen prevails. (d) H2 production as a function of the charge that was transferred between the anode and cathode. Dashed black line corresponds to a Faradic efficiency of 100%. The error bars represent the s.d. over four independent measurements.
Figure 7
Figure 7. PV–BPEC tandem cell.
(a) Photograph of the tandem cell. (b) Illustration of the electron transfer pathway in the tandem cell. (c) Hydrogen evolution at the cathode in the presence (red squares) or absence (black diamonds) of the herbicide DCMU. (d) The influence of the incident light intensity (Pin) on the photocurrent (blue curve) and power accumulated in hydrogen bonds (red curve) produced by the tandem cell. The error bars in c,d represent the s.d. in four independent measurements.

References

    1. Barber J & Tran P. D. From natural to artificial photosynthesis. J. R. Soc. Interface 10, 20120984 (2013). - PMC - PubMed
    1. Cook T. R. et al.. Solar energy supply and storage for the legacy and nonlegacy worlds. Chem. Rev. 110, 6474–6502 (2010). - PubMed
    1. Lewis N. S. & Nocera D. G. Powering the planet: chemical challenges in solar energy utilization. Proc. Natl Acad. Sci. USA 103, 15729–15735 (2006). - PMC - PubMed
    1. British-Petroleum. Statistical review of world energy. Available at http://www.bp.com/en/global/corporate/energy-economics/statistical-revie... (2015).
    1. Zhu X.- G., Long S. P. & Ort D. R. Improving photosynthetic efficiency for greater yield. Annu. Rev. Plant Biol. 61, 235–261 (2010). - PubMed

Publication types

LinkOut - more resources