. 2016 Aug 23:6:31857.
doi: 10.1038/srep31857.

High-fat diet disrupts metabolism in two generations of rats in a parent-of-origin specific manner

Affiliations

High-fat diet disrupts metabolism in two generations of rats in a parent-of-origin specific manner

T J G Chambers et al. Sci Rep. .

Abstract

Experimental and epidemiological evidence demonstrate that ancestral diet might contribute towards offspring health. This suggests that nutrition may be able to modify genetic or epigenetic information carried by germ cells (GCs). To examine if a parental high fat diet (HFD) influences metabolic health in two generations of offspring, GC-eGFP Sprague Dawley rats were weaned onto HFD (45% fat) or Control Diet (CD; 10% fat). At 19 weeks, founders (F0) were bred with controls, establishing the F1 generation. HFD resulted in 9.7% and 14.7% increased weight gain in male and female F0 respectively. F1 offspring of HFD mothers and F1 daughters of HFD-fed fathers had increased weight gain compared to controls. F1 rats were bred with controls at 19 weeks to generate F2 offspring. F2 male offspring derived from HFD-fed maternal grandfathers exhibited increased adiposity, plasma leptin and luteinising hormone to testosterone ratio. Despite transmission via the founding male germline, we did not find significant changes in the F0 intra-testicular GC transcriptome. Thus, HFD consumption by maternal grandfathers results in a disrupted metabolic and reproductive hormone phenotype in grandsons in the absence of detectable changes in the intra-testicular GC transcriptome.


Conflict of interest statement

The authors declare no competing financial interests.

Figures
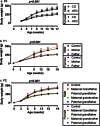
Figure 1
Figure 1. Growth curves of rats in each generation.
(a) Body weight of F0 rats fed a control diet (CD; black lines, closed symbols) or a high fat (HFD; grey lines, open symbols) for 14 weeks. Data are shown for male (squares) and female (circles) rats. Data were analysed by linear mixed model with diet and sex as fixed factors, time as a repeated factor and cohort as a random factor with Bonferroni post hoc testing for effect of diet within a sex. N = 22–35 males and 10–18 females from two cohorts. *p < 0.05 HFD vs CD. (b) Body weight of F1 rats according to diet of the F0 parents. Analysis was by linear mixed model with group and sex as fixed factors and litter as a random factor. N = 13–32 males from 5–9 litters and 10–21 females from 5–9 litters. *p < 0.05 maternal high fat diet vs. both parents on control diet. ^p < 0.05 maternal or paternal high fat diet vs. both parent control diet. (c) Bodyweight of F2 rats from birth to 18 weeks of age. Analysis was by linear mixed model with sex and group as fixed factors, time as a repeated factor and litter as a random factor and post hoc Bonferroni analysis. *p < 0.05 maternal grandfather high fat diet vs. control. Data are means ± SEM.
Figure 2
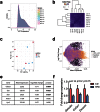
Figure 2. Effect of 14-week exposure to a high fat diet (HFD) or a control diet (CD) on the intra-testicular GC protein-coding transcriptome of F0 male rats.
(a) The distribution of variance stabilising transformed (VST) expression of annotated protein-coding genes was unaffected by diet and was highly consistent across biological replicates. (b) Hierarchical clustering on the sample correlation matrix of gene expression indicated that the HFD and CD samples are highly similar. (c) Principal components analysis (PCA) was unable to distinguish samples according to diet. (d) Differential expression testing identified 3 protein-coding genes that were statistically significantly down-regulated in response to HFD (see e). A post hoc power analysis by simulation showed that the few HFD-induced changes were not due to a lack of statistical power given the same expression value and fold change range (Orange points = HFD vs. CD comparison; black points = statistically significantly differentially expressed genes between HFD and CD, including the simulated genes; purple points = simulated genes comparison). (e) The top 5 most differentially expressed genes in GCs of HFD-fed rats when compared with CD-fed rats. Mean expression indicates the expression level in GCs from CD animals, normalised for library size and averaged across 4 replicates; p-values were adjusted for multiple testing. (f) RT-qPCR validation analysis for the differentially expressed genes in (e). (Means ± SEM for n = 11–12).
Figure 3
Figure 3. Effect of 14-week exposure to a high fat diet (HFD) or a control diet (CD) on regulatory miRNA expression in the intra-testicular GCs of male F0 rats.
(a) The distribution of expression of annotated Rattus norvegicus miRNAs within GCs was unaffected by paternal diet. Expression was more variable between replicates than for the protein-coding mRNAs (Fig. 2), but showed that the majority of miRNAs were relatively lowly expressed (shown as Variance Stabilised expression). (b) Hierarchical clustering of miRNA expression showed that the HFD and CD samples had high similarity. (c) Principle components analysis (PCA) did not separate samples according to HFD or CD over the first two principal components, which together explained the majority of the variance in miRNA expression between samples. (d) Differential expression testing of miRNA expression identified a single miRNA (rno-mir-10b) that was significantly down-regulated in the HFD group compared with CD. This small but statistically significant change was mirrored in a post hoc power analysis by simulation that demonstrated a similar proportion of differentially expressed spike-in miRNAs (0.35% vs 0.48%) (Orange points = HFD vs. CD comparison; black points = statistically significantly differentially expressed genes between HFD and CD (including simulated genes); purple points = simulated gene comparison). (e) Top 3 most differentially expressed miRNAs in GCs of HFD-fed rats when compared with CD-fed rats. The miRNA rno-mir-10b is highly expressed and demonstrates a modest difference between HFD and CD groups. P-values were adjusted for multiple testing. (f) RT-qPCR validation analysis for the down-regulation of rno-mir-10b. Values are Means ± SEM for n = 8.

References

    1. Ng M. et al.. Global, regional, and national prevalence of overweight and obesity in children and adults during 1980–2013: a systematic analysis for the Global Burden of Disease Study 2013. Lancet 384, 766–781 (2014). - PMC - PubMed
    1. Wang Y. C., McPherson K., Marsh T., Gortmaker S. L. & Brown M. Health and economic burden of the projected obesity trends in the USA and the UK. Lancet 378, 815–825 (2011). - PubMed
    1. WHO. WHO| Obesity and overweight. WHO (2014). Available at: http://www.who.int/mediacentre/factsheets/fs311/en/. (Accessed: 21st May 2014).
    1. Locke A. E. et al.. Genetic studies of body mass index yield new insights for obesity biology. Nature 518, 197–206 (2015). - PMC - PubMed
    1. Patro B. et al.. Maternal and Paternal Body Mass Index and Offspring Obesity: A Systematic Review. Ann. Nutr. Metab. 63, 32–41 (2013). - PubMed

Publication types

MeSH terms