

Tunneling nanotubes spread fibrillar α-synuclein by intercellular trafficking of lysosomes
- PMID: 27550960
- PMCID: PMC5048354
- DOI: 10.15252/embj.201593411
Tunneling nanotubes spread fibrillar α-synuclein by intercellular trafficking of lysosomes
Abstract
Synucleinopathies such as Parkinson's disease are characterized by the pathological deposition of misfolded α-synuclein aggregates into inclusions throughout the central and peripheral nervous system. Mounting evidence suggests that intercellular propagation of α-synuclein aggregates may contribute to the neuropathology; however, the mechanism by which spread occurs is not fully understood. By using quantitative fluorescence microscopy with co-cultured neurons, here we show that α-synuclein fibrils efficiently transfer from donor to acceptor cells through tunneling nanotubes (TNTs) inside lysosomal vesicles. Following transfer through TNTs, α-synuclein fibrils are able to seed soluble α-synuclein aggregation in the cytosol of acceptor cells. We propose that donor cells overloaded with α-synuclein aggregates in lysosomes dispose of this material by hijacking TNT-mediated intercellular trafficking. Our findings thus reveal a possible novel role of TNTs and lysosomes in the progression of synucleinopathies.
Keywords: TNTs; intercellular transfer; synucleinopathies; α‐synuclein.
© 2016 The Authors.
Figures
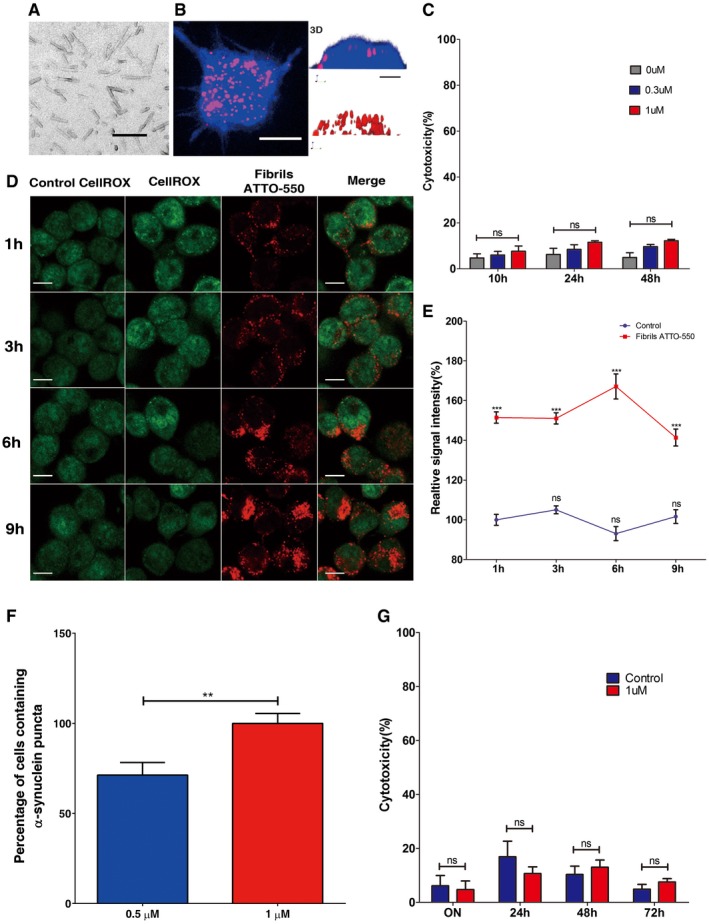
Electron micrographs of α‐synuclein fibrils used throughout this study. The scale bar represents 100 nm. Fibrillar α‐synuclein was adsorbed to a carbon‐coated copper grid and stained with freshly prepared 1% uranyl acetate. Samples were imaged using a JEOL 1400 electron microscope equipped with an LaB6 filament and operated at 80 kV, and 10,000× magnification, images were recorded with a Gatan Orius CCD camera (Gatan).
The left panel shows representative Z‐stack projection of confocal images showing neuron‐like CAD cells after loading with α‐synuclein fibrils for 16 h. Cells were then trypsin‐washed, fixed and labelled with HCS CellMask Blue; scale bar is 10 μm. The right panel depicts the (z, y) three‐dimensional reconstruction (3D) of a cell loaded with fibrils shown in the confocal image (left panel); scale bar is 5 μm. As seen on the three‐dimensional images, α‐synuclein fibrils are present only in the cytosol and not at the plasma membrane.
Cell toxicity was measured by LDH release in neuron‐like cells after 10, 24 and 48 h of loading increasing concentrations of sonicated α‐synuclein fibrils. The bar graph represents the percentage of cytotoxicity normalized to control values. There were no significant differences between control and α‐synuclein‐loaded cells at any of the time points or concentrations evaluated. Ns, not significant by two‐way Student's t‐test.
Representative images showing intracellular ROS levels in neuron‐like cells upon addition of 1 μM of α‐synuclein fibrils for up to 9 h. Intracellular ROS was measured by CellRox Green fluorescence in control and α‐synuclein‐loaded cells (red). Scale bars are 10 μm.
The graph shows the percentage of the relative fluorescence intensity of intracellular ROS at different time points in α‐synuclein‐loaded CAD cells and controls. The values show ˜50% increase in ROS production at all time points. ***P < 0.001 compared to the control condition. Ns, not significant by two‐way Student's t‐test.
Quantification of the percentage of primary cortical neurons containing α‐synuclein puncta after 16 h of incubation with 0.5 μM (blue bar) and 1 μM (red bar) of α‐synuclein fibrils. **P < 0.001 by two‐way Student's t‐test.
Cell toxicity was measured by LDH release in primary neurons on addition of 1 μM of sonicated α‐synuclein fibrils for 16, 24, 48 and 72 h. The bar graph represents the percentage of cytotoxicity normalized to control values. There were no significant differences between control (blue bar) and α‐synuclein‐loaded (red bar) cells at any of the time points evaluated. Ns, not significant by two‐way Student's t‐test.
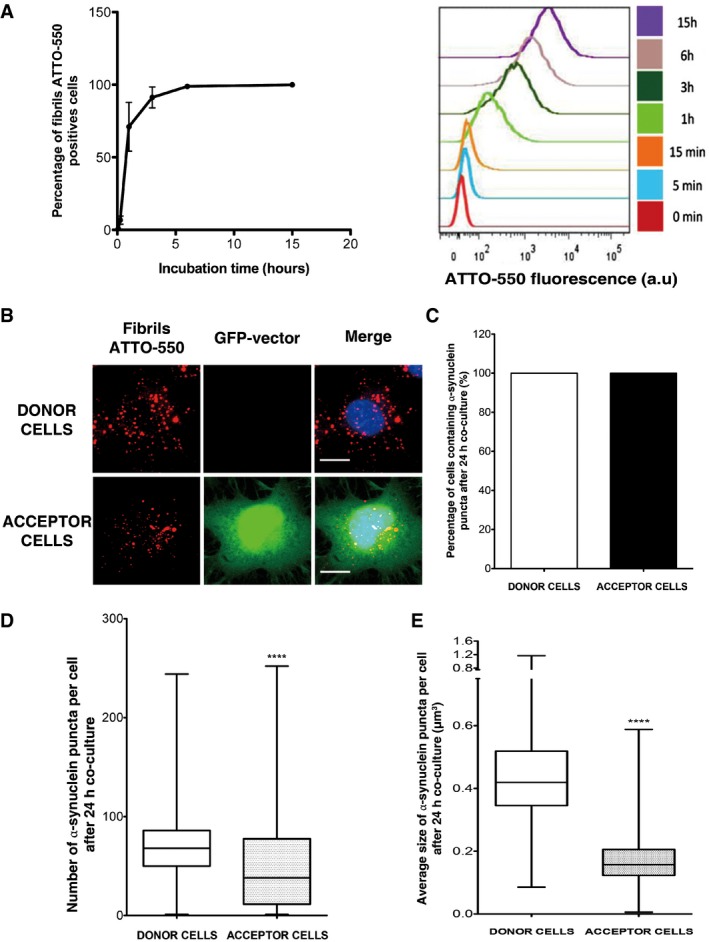
Time course of rapid internalization of fluorescent α‐synuclein fibrils by CAD cells (for characterization of α‐synuclein assemblies, see Fig EV1A). Internalization was measured by recording ATTO‐550‐positive neuron‐like cells by flow cytometry. Percentage of ATTO‐550‐positive cells was quantified (mean ± s.e.m.) (left panel) and representative histograms of ATTO‐550‐positive cells are shown on the right panel (a.u., arbitrary units). n = 3 independent experiments. Similarly, α‐synuclein fibril internalization was also confirmed by fluorescent microscopy (see Fig EV1B).
Representative images of donor (upper panel) and acceptor cells (lower panel) after 24‐h co‐culture. Donor cells were loaded with α‐synuclein fibrils prior to co‐culture with GFP‐transfected acceptor cells: in red, α‐synuclein fibrils; in green, acceptor cells; and in blue, nuclei. Scale bars represent 10 μm. n = 3 independent experiments. A larger field where donor and acceptor cells are shown is presented in Fig EV3A.
Percentage of donor and acceptor cells containing α‐synuclein fibrils after co‐culture as in (B): all acceptor cells received α‐synuclein fibrils.
Quantification of the number of α‐synuclein fibrils in donor and acceptor cells after co‐culture as in (B). Donor cells contain around 70 α‐synuclein fibril puncta (median), while acceptor cells contain 38 α‐synuclein fibril puncta, respectively (****P < 0.0001 by two‐tailed Mann–Whitney U‐test).
Quantification of the average size of α‐synuclein fibrillar foci in donor and acceptor cells after co‐culture as in (B) (****P < 0.0001 by two‐tailed Mann–Whitney U‐test). See also Fig EV3 for an example of α‐synuclein fibrillar puncta detection in an acceptor cell. After detection, the number and the size of foci were determined using the ICY software.
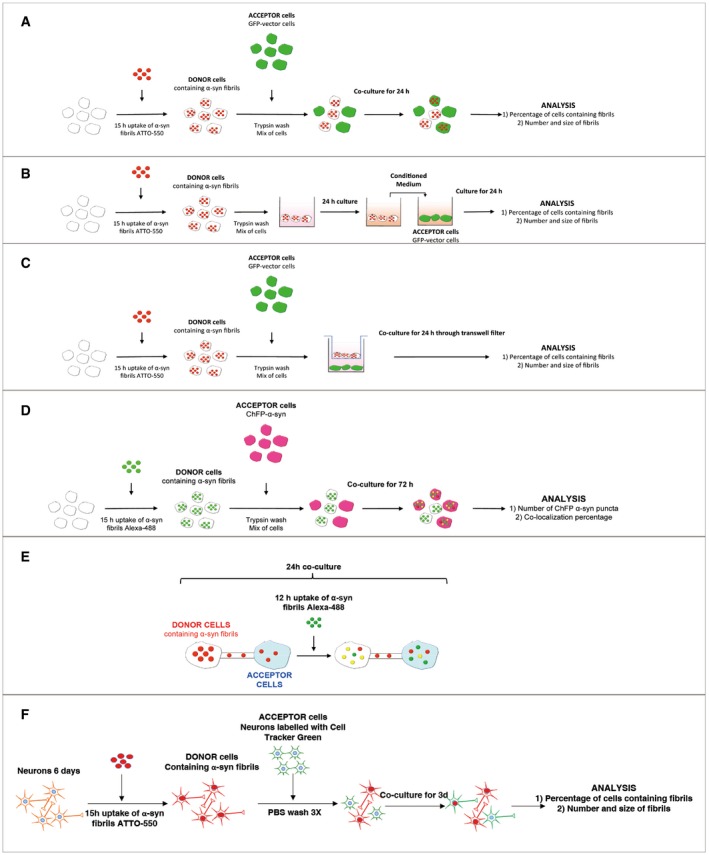
Experimental set‐up used for the co‐culture experiment (also referred to as a transfer experiment). CAD neuron‐like cells are loaded for 16 h with human fluorescent ATTO‐550 α‐synuclein fibrils. Cells are trypsin‐washed and are used as “Donor cells” since their cytosol is loaded with α‐synuclein fibrils. Donor cells are mixed with GFP‐transfected cells referred to as “Acceptor cells” for 24 h. Then, the co‐culture is fixed and imaged and (i) the percentage of cells containing ATTO‐550 α‐synuclein fibrils and (ii) the average number and size of ATTO‐550 α‐synuclein fibrils per cells are quantified using ICY software.
Experimental set‐up used for the conditioned medium experiment. This experiment allows investigating the contribution of secretion to cell‐to‐cell α‐synuclein fibril transfer. Here, donor cells are obtained as described in (A) (i.e. loading followed by trypsin wash) and then cultured for 24 h. The medium of donor cells referred to as conditioned medium (CM) is entirely collected and used as is to culture GFP‐transfected acceptor cells for 24 h. The same analysis described in (A) is performed (i.e. percentage of cells containing α‐synuclein fibrils, number and size of α‐synuclein fibrils per cells) but also quantitative analysis of the amount of fibrils within donor cells and the culture medium by filter trapping on cellulose acetate membranes.
Experimental set‐up used for the filter experiment. This set‐up was designed to separate donor and acceptor cells to investigate the contribution of (i) secretion or/and (ii) cell contact to transfer. The co‐culture is performed similarly as described in (A) with the exception that donor cells are plated in the well, and then a transwell filter is placed on top of which acceptor cells are plated. After 24‐h co‐culture, the same analysis is performed (see A).
Experimental set‐up used for the seeding experiment. Here, donor cells loaded with α‐synuclein fibrils Alexa‐488 (and trypsin‐washed as described in A) were co‐cultured with acceptor cells overexpressing ChFP‐α‐synuclein for 72 h. The number of ChFP‐α‐synuclein fibril puncta as well as the co‐localization rate between α‐synuclein fibrils Alexa‐488 and ChFP α‐synuclein fibril puncta was quantified.
Schematic of the experimental design of exogenous α‐synuclein fibril internalization in co‐cultured cells. Donor cells previously loaded with ATTO‐550 α‐synuclein fibrils were co‐cultured with untransfected acceptor cells for 24 h. After 12 h of co‐culture, cells were challenged with α‐synuclein fibrils Alexa‐488 (i.e. exogenously added α‐synuclein fibrils) for an additional 12 h.
Schematic of the experimental design of α‐synuclein fibril internalization and transfer between primary neurons. Donor neurons pre‐loaded with ATTO‐550 α‐synuclein fibrils were co‐cultured with CTG‐labelled acceptor neurons for 72 h. Acceptor neurons were prepared from a different dissection and labelled in suspension before adding them on top of the donor neurons. After 72 h, the cells are fixed and imaged and (i) the percentage of cells containing α‐synuclein puncta and (ii) the number and average size of α‐synuclein puncta per cell are quantified using ICY software.
- A
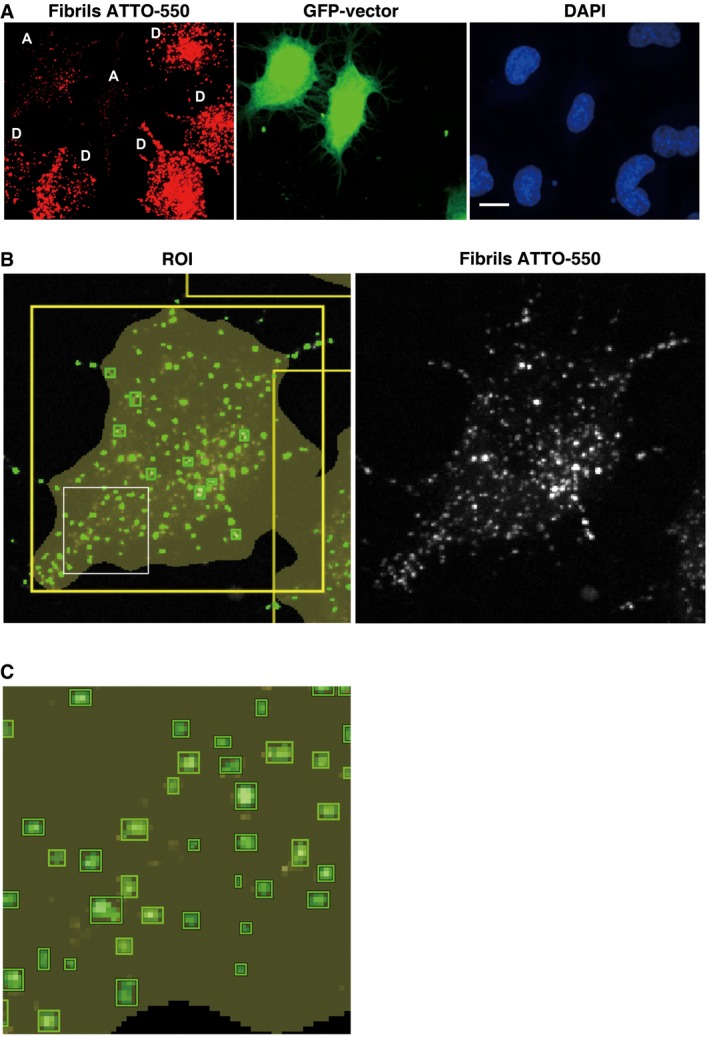
Representative confocal picture of donor cells loaded with α‐synuclein fibrils (D, in red), co‐cultured with GFP vector‐transfected acceptor cells (A, in green) and stained with DAPI (in blue). Scale bar represents 10 μm.
- B, C
Representative confocal picture of an acceptor cell from (A) (top left cell) showing cell segmentation (large yellow ROI) and detection of α‐synuclein fibrils in small green square ROIs (left panel). The green square ROIs change in size according to the size of the fibrils. Thereby the large fibrils are seen in green squares and the smaller fibrils appear in small green spots which when the magnification is increased resolve into squares as seen in the inset in (C). Note in (B) the correlation between α‐synuclein fibrils (in white, right panel) and the spots detected by the software (in green, left panel).
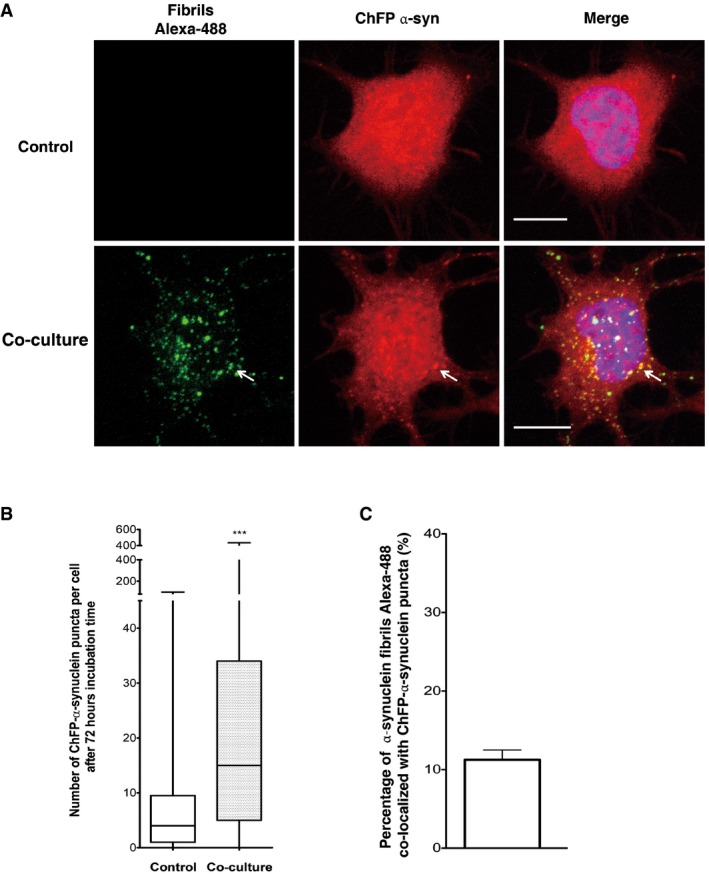
Representative confocal images showing ChFP‐α‐syn‐transfected cells (in red) cultured alone (upper) or co‐cultured with donor cells containing fluorescent Alexa‐488 α‐synuclein fibrils (in green) for 72 h (bottom). The arrow is pointing out representative α‐synuclein fibrils co‐localized with ChFP‐α‐syn puncta. Scale bars represent 10 μm. Nuclei are stained with DAPI (blue). n = 3 independent experiments.
Quantification of the number of ChFP‐α‐synuclein puncta in ChFP‐α‐syn acceptor cells showed a significant increase in ChFP‐α‐synuclein puncta number when cells were co‐cultured with donor cells containing α‐synuclein fibrils (***P < 0.001 by two‐tailed Mann–Whitney U‐test). In the box and whisker plot, boxes extend from the first to the third quartile, the line inside the boxes shows the median and the whiskers represent the min/max value of at least 100 cells scored for each independent experiment (n = 3).
Quantification of the percentage of co‐localization of α‐synuclein fibrils Alexa‐488 and ChFP‐α‐syn puncta. Data are shown as mean ± s.e.m. After co‐culture, 11% of the transferred α‐synuclein fibrils Alexa‐488 co‐localized with ChFP‐α‐syn puncta. n = 3 independent experiments.
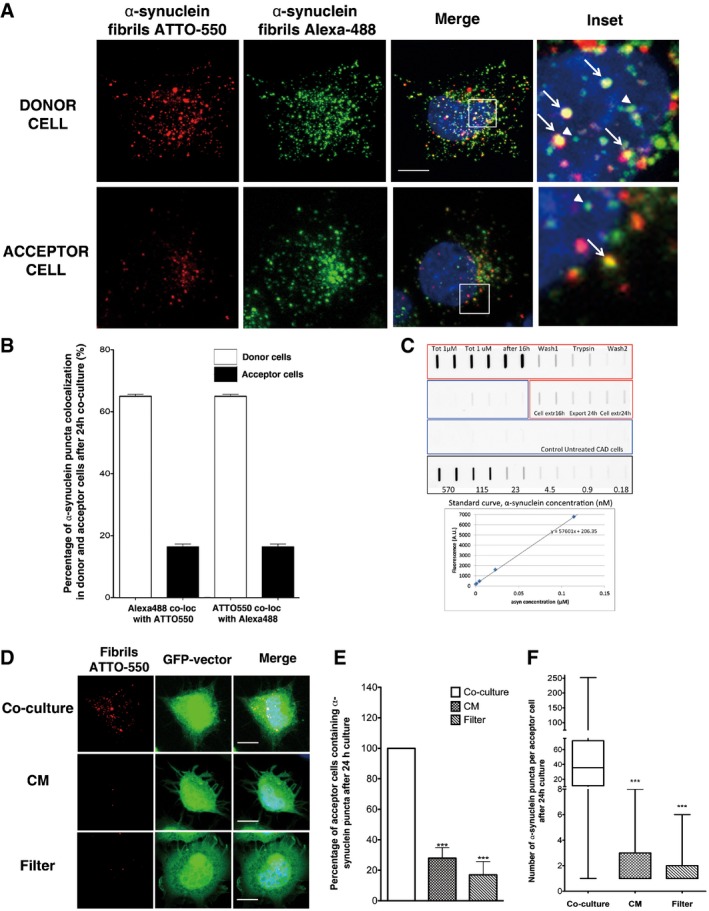
Representative images of donor cells (upper panel) and acceptor cells (bottom panel) of the co‐culture system explained in Fig EV2E: in red, ATTO‐550 α‐synuclein fibrils; in green, α‐synuclein fibrils Alexa‐488; and in blue, nuclei. Scale bar represents 10 μm (n = 3 independent experiments). In insets, arrows point to co‐localized ATTO‐550 and Alexa‐488 α‐synuclein fibril puncta, whereas arrowheads point to puncta of α‐synuclein Alexa‐488 fibrils that do not co‐localize with fibrillar ATTO‐550 α‐synuclein.
Quantification of the percentage of Alexa‐488 α‐synuclein fibrils co‐localizing with ATTO‐550 α‐synuclein fibrils and the reverse co‐localization in discrete puncta in donor and acceptor cells as in (A). Both measurements revealed high co‐localization of the two fluorophores in donor cells (white bar), but less in acceptor cells. Data are shown as mean ± s.e.m. of 3 independent experiments.
The amount of fibrils taken up by CAD cells exposed to 1 μM fibrils, remaining in the cells and exported into the medium after 24‐h incubation was quantified by a filter trap assay. n = 3 independent measurements, filtered in duplicate. The standard fluorescence curve for increasing ATTO‐550 α‐synuclein fibril concentrations is given.
Representative images of GFP‐transfected acceptor cells that were either (i) co‐cultured with donor cells (upper panel, Co‐culture), (ii) cultured with the conditioned medium of donor cells (middle panel, CM) or (iii) physically separated from donor cells using a filter (bottom panel, Filter). Prior to culture, donor cells were loaded with ATTO‐550 α‐synuclein fibrils. In red: α‐synuclein fibrils, in green: acceptor cells and in blue: nuclei. Scale bars represent 10 μm. n = 3 independent experiments.
Quantification of the percentage of acceptor cells containing α‐synuclein fibrils from images such as those presented in (C). When acceptor cells were cultured with the conditioned medium from donor cells previously treated with α‐synuclein fibrils (not diluted, concentrated or diluted) or co‐cultured with a filter, the percentage of acceptor cells containing α‐synuclein puncta was low. Data are shown as mean ± s.e.m. of 3 independent experiments. ***P < 0.001 by two‐tailed Student's t‐test.
Quantification of the number of puncta of α‐synuclein fibrils per acceptor cell from (D). While in co‐culture conditions the number of α‐synuclein puncta in acceptor cells is on average 35 (median), this number was on average 1 puncta per acceptor cells in both CM and filter conditions (***P < 0.001 by two‐tailed Mann–Whitney U‐test). In the box and whisker plot, boxes extend from the first to the third quartile, the line inside the boxes shows the median and the whiskers represent the min/max value of at least 100 cells scored for each independent experiment (n = 3).
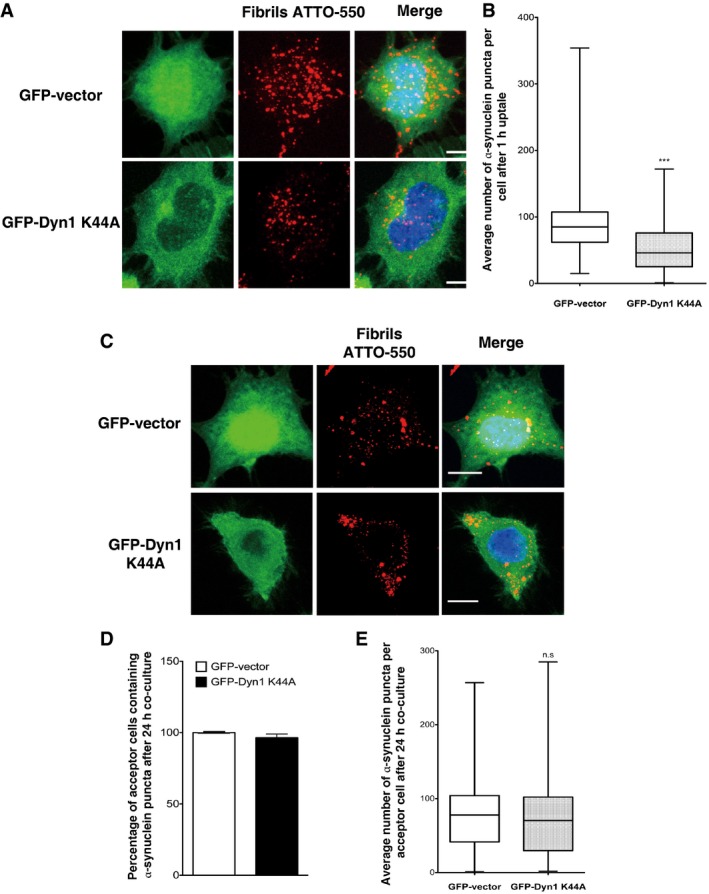
Representative images of GFP vector (upper panel) or GFP‐dynamin‐1 K44A‐transfected cells (bottom panel) challenged for 1 h with ATTO‐550 α‐synuclein fibrils, trypsin‐washed and then fixed: in red, α‐synuclein fibrils; in green, GFP vector or GFP‐dynamin‐1 K44A‐transfected cells; and in blue, nuclei. Scale bars represent 5 μm. n = 3 independent experiments.
Quantification of the average number of α‐synuclein fibrils per cell obtained from experiments in (A) shows a significant decrease in the number of α‐synuclein fibrils in dynamin dominant‐negative cells (GFP‐Dyn1 K44A) compared to control cells (GFP vector) indicating a partial dynamin‐dependent mechanism of α‐synuclein fibril uptake in neuron‐like cells (***P < 0.001 by two‐tailed Mann–Whitney U‐test). n = 3 independent experiments.
Representative images of GFP vector (upper panel) or GFP‐dynamin‐1 K44A‐transfected acceptor cells (bottom panel) after 24‐h co‐culture with donor cells loaded with α‐synuclein fibrils: in red, α‐synuclein fibrils; in green, GFP vector or GFP‐dynamin‐1 K44A‐transfected acceptor cell; and in blue, nuclei. Scale bars represent 10 μm. n = 3 independent experiments.
Relative percentage of acceptor cells containing α‐synuclein fibrils after co‐culture as in (C) revealed that transfer of α‐synuclein fibrils does not depend on dynamin‐1. Data are shown as mean ± s.e.m. (n.s. with GFP vector raw percentage set to 100%, not significant by Student's t‐test).
Quantification of the average number of α‐synuclein fibrils per acceptor cells after co‐culture as in (C) showing no significant difference in the number of α‐synuclein fibrils in acceptor cells in control (GFP vector) and dynamin dominant‐negative (GFP‐Dyn1 K44A) conditions. Data are shown as mean ± s.e.m. of three independent experiments (n.s., not significant by two‐tailed Mann–Whitney U‐test).
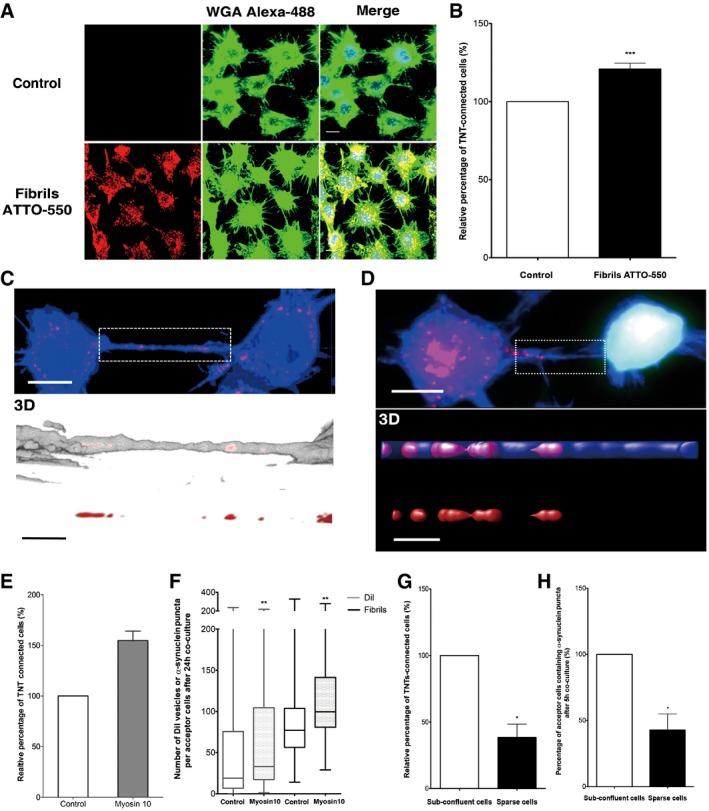
Representative images of control cells (upper panel) or cells treated with ATTO‐550 α‐synuclein fibrils (bottom panel) for 16 h: in red, α‐synuclein fibrils; in green, WGA Alexa‐488 (plasma membrane dye marker); in blue, DAPI. Scale bar represents 10 μm. n = 3 independent experiments.
Relative percentage of TNT‐connected cells after α‐synuclein fibril treatment as in (A) shows an increase in TNT number upon fibril treatment. Data are shown as mean ± s.e.m. (***P < 0.001 by paired, two‐tailed Student's t‐test).
Confocal images showing one TNT connecting two cells loaded with ATTO‐550 α‐synuclein fibrils (in red) 16 h after co‐culture and stained with WGA Alexa‐488 (in blue). The image represents a Z‐projection of the several middle stacks where the TNT is located (top panel). Insets show 3D reconstructions of the TNT using ICY software (middle panel, merge; bottom panel, red channel). Several α‐synuclein fibrils (red) are present in the lumen of the TNT (WGA Alexa‐488 in white). Scale bars represent 10 μm (confocal images) and 4 μm (insets).
Confocal image showing a TNT connecting a donor cell containing α‐synuclein fibrils and a GFP‐transfected acceptor cell (top panel) strongly suggesting α‐synuclein fibril transfer from donor to acceptor cell. Insets show 3D reconstructions of TNT containing α‐synuclein fibrils in the lumen of the TNT: in red, α‐synuclein fibrils; in green, GFP‐transfected acceptor cells; in blue, WGA Alexa‐633. Scale bars represent 10 μm (confocal images) and 3 μm (insets).
Relative percentage of TNTs in cells containing α‐synuclein fibrils untransfected (control) or transfected with myosin‐10 (myosin‐10). Overexpression of myosin‐10 in the donor cell population led to an increase in the number of TNTs. Data are shown as mean ± s.e.m.
Quantification of the average number of ATTO‐550 α‐synuclein fibrils per acceptor cell after 24‐h co‐culture with donor cells containing α‐synuclein fibrils untransfected (control) or transfected with myosin‐10 (myosin‐10). In the box and whisker plot, boxes extend from the first to the third quartile, the line inside the boxes shows the median and the whiskers represent the min/max value of at least 100 cells scored for each independent experiment (n = 3). Note that myosin‐10 overexpression increases both the transfer of vesicles labelled with the liophilic dye DiI and the number of transferred α‐synuclein puncta in acceptor cells; n = 3 independent experiments (**P < 0.01 by two‐tailed Mann–Whitney U‐test).
Quantification of the relative proportion of TNTs in co‐culture of donor cells containing α‐synuclein puncta and GFP acceptor cells under sub‐confluent or sparse culture conditions. Data are shown as mean ± s.e.m.; n = 3 independent experiments (*P < 0.05 by paired, two‐tailed Student's t‐test).
Quantification of the percentage of acceptor cells containing α‐synuclein puncta of the co‐culture in (G). n = 3 independent experiments (*P < 0.05 by two‐tailed Mann–Whitney U‐test). Conditions impairing TNT formation (i.e. sparse conditions) induce a drastic decrease in TNT number and α‐synuclein fibril transfer compared to conditions allowing TNT formation (sub‐confluent conditions). Data are shown as mean ± s.e.m.
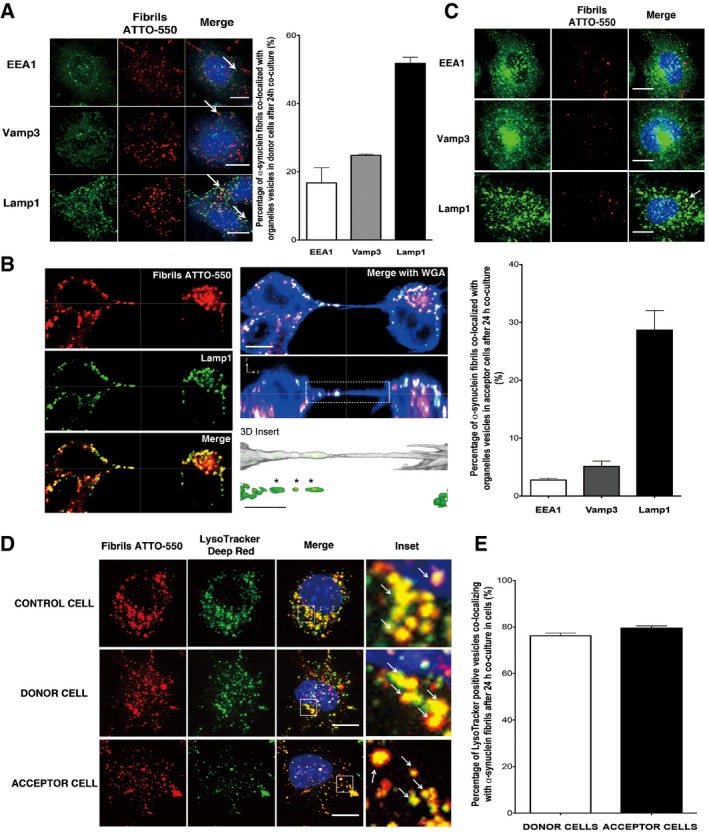
Subcellular localization of α‐synuclein fibrils in donor cells after 24‐h co‐culture. The left panels show representative images of co‐localization of α‐synuclein puncta with early endosomes (EEA1, top panel), recycling endosomes (Vamp3, middle panel) and lysosomal vesicles (Lamp1, bottom panel) (see arrows for co‐localized spots): in red, α‐synuclein fibrils; in green, EEA1, Vamp3 or Lamp1; and in blue, nuclei. Scale bars represent 10 μm. On the right, the bar graph represents the percentage of α‐synuclein puncta co‐localized with endolysosomal vesicles. Data are shown as mean ± s.e.m. from three independent experiments.
Confocal images showing a TNT connecting two cells loaded with ATTO‐550 α‐synuclein fibrils immunostained with Lamp1 (in green). Labelling of TNTs is performed using a plasma membrane dye (WGA Alexa‐633, in blue). The image represents a Z‐projection of the several middle stacks where the TNT is located. The merged image with WGA Alexa‐633 (blue), the orthogonal view and insets showing 3D reconstructions of the TNT (with WGA in white) are on the right. Several α‐synuclein fibrillar foci (in red) are present in the lumen of the TNT and embedded in Lamp1‐positive vesicles (in green). Of note, only tubular structures physically connecting remote cells and not touching the substratum were identified as TNTs to distinguish them from filopodia. Scale bars represent 10 μm (confocal images) and 3 μm (insets). The merged image of α‐synuclein fibrils (red) and Lamp1 (green) channels and the respective single channels are shown on the left panel.
The top panels show representative images of GFP‐transfected acceptor cells after 24‐h co‐culture with donor cells containing ATTO‐550 α‐synuclein fibrils. Immunofluorescence was performed with endolysosomal organelle markers (top panel, EEA1; middle panel, Vamp3; and bottom panel, Lamp1) and revealed that α‐synuclein fibrils co‐localized with lysosomal vesicles (see arrow): in red, α‐synuclein fibrils; in green, organelle markers; and in blue, nuclei. Scale bars represent 10 μm. The bar graph below shows the quantification of the percentage of co‐localization of α‐synuclein fibrils with organelle markers, revealing that α‐synuclein puncta co‐localized mostly with lysosomal vesicles. Data are shown as mean ± s.e.m. from three independent experiments.
Representative confocal pictures of control cells loaded with ATTO‐550 α‐synuclein fibrils and LysoTracker Deep Red (top panel), and of donor cells previously loaded with ATTO‐550 α‐synuclein fibrils and LysoTracker Deep Red (middle panel), that were co‐cultured for 24 h with GFP‐transfected acceptor cells (bottom panel, GFP vector not shown). In red, α‐synuclein fibrils; in green, LysoTracker Deep Red; and in blue, nuclei. Scale bars represent 10 μm, and arrows in inset pinpoint fibrils co‐localizing with LysoTracker‐positive vesicles.
The percentage of co‐localization of LysoTracker‐positive vesicles with α‐synuclein fibrils revealed that 80% of lysosomal vesicles that transferred from donor to acceptor cells contained α‐synuclein fibrils, thus demonstrating direct transfer of α‐synuclein fibrils from donor to acceptor cells in majority inside lysosomal vesicles derived from donor cells. Data are shown as mean ± s.e.m. from three independent experiments.
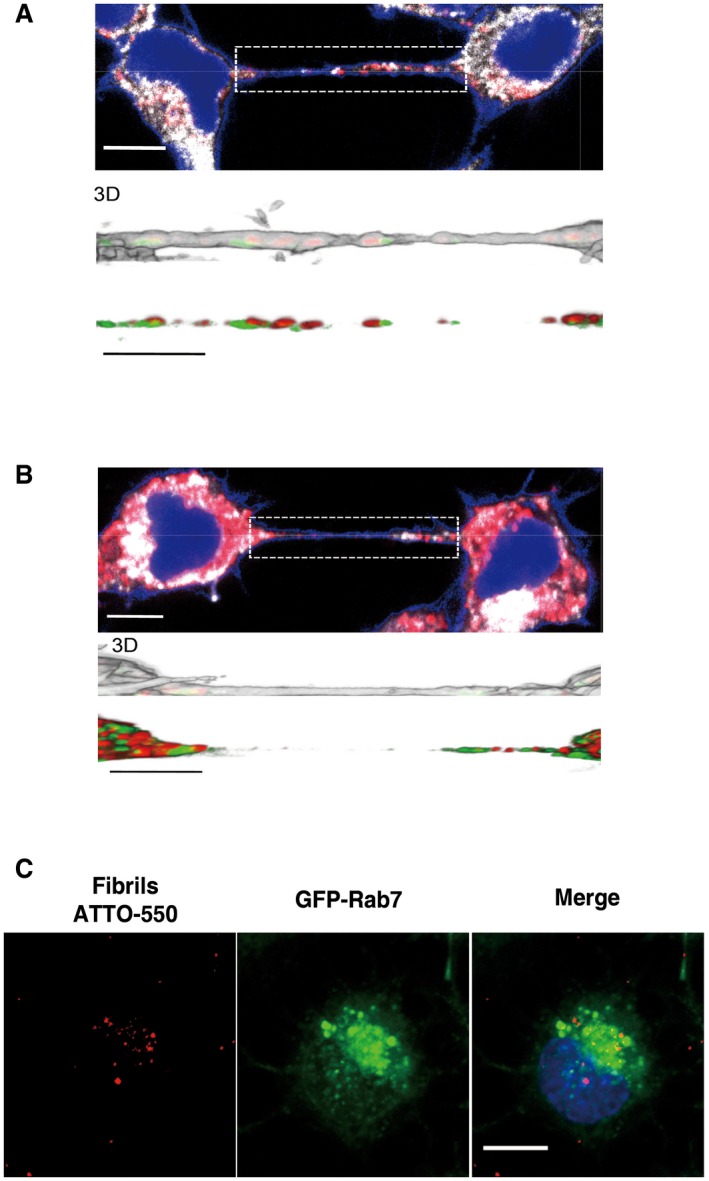
- A, B
Confocal images showing a TNT connecting two cells loaded with red ATTO‐550‐labelled α‐synuclein fibrils immunostained with EEA1 (A) or Vamp3 (B) (in white) and stained with WGA Alexa‐488 (in blue). The images represent a Z‐projection of the several middle stacks where TNTs are located. Insets show 3D reconstructions of TNTs using ICY software: red, ATTO‐550 fibrils; green, EEA1 (A) or Vamp3 (B); white, WGA Alexa‐488. Several α‐synuclein fibrils are present in the lumen of the TNT but do not co‐localize with EEA1 (A)‐ or Vamp3 (B)‐positive vesicles. Scale bars represent 10 μm (confocal images) and 3 μm (insets).
- C
Representative confocal images of GFP‐Rab7‐transfected acceptor cells after co‐culture (with donor cells containing ATTO‐550 α‐synuclein fibrils) show no co‐localization between transferred α‐synuclein fibrils (in red) and GFP‐Rab7‐positive vesicles (in green). Scale bar represents 10 μm, and the nucleus is in blue (n = 3 independent experiments).
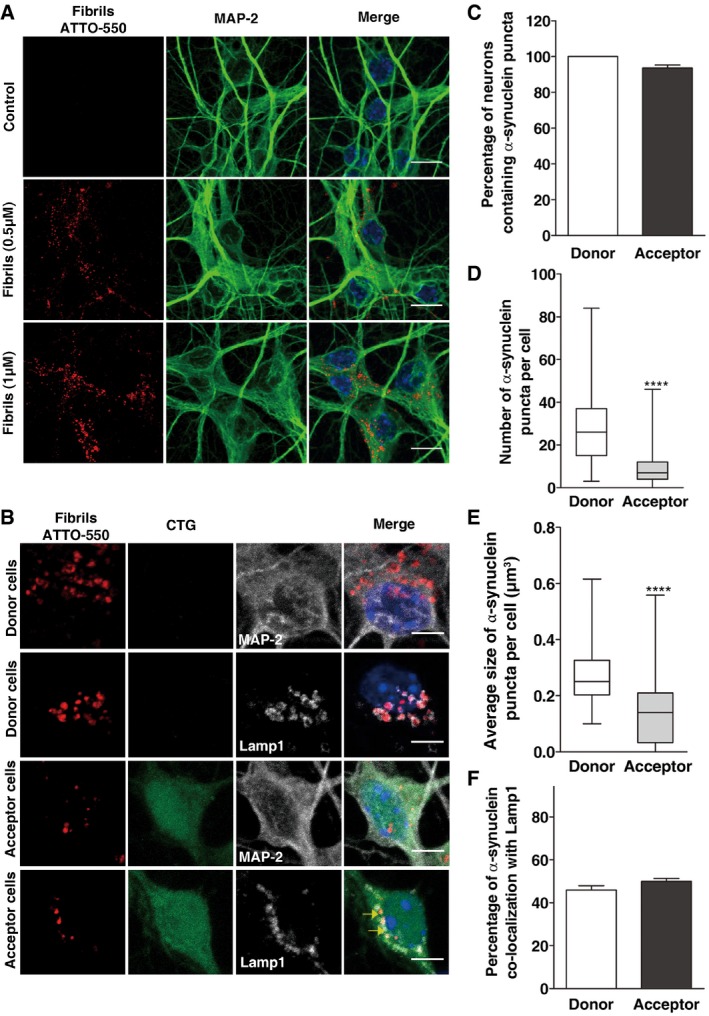
Representative images of control (upper panel) and α‐synuclein‐loaded (middle, 0.5 μM; bottom, 1 μM) neurons after 16 h. In red, α‐synuclein fibrils; in green, MAP‐2; and in blue, nuclei. Scale bars represent 10 μm.
Representative images of donor (upper panels) and acceptor neurons (bottom panels) after 72 h of co‐culture. Donor neurons were loaded with α‐synuclein fibrils prior to co‐culture with CTG‐labelled acceptor neurons and then cells were labelled either with MAP‐2 (first and third panels) or Lamp1 (second and fourth panels). In red, α‐synuclein fibrils; in green, CTG; in white, MAP‐2/Lamp1; and in blue, nuclei. Scale bars represent 5 μm. Yellow arrows point to co‐localized ATTO‐550 α‐synuclein puncta and Lamp1.
The graph bar shows the percentage of donor (white bar) and acceptor (black bar) neurons containing α‐synuclein puncta. Data are shown as mean ± s.e.m.
The box plot depicts the number of puncta in donor (white) and acceptor (grey) neurons.
Box plot showing the distribution of the average size of α‐synuclein puncta in donor (white) and acceptor (grey) neurons.
The graph bar represents the percentage of α‐synuclein puncta co‐localized with lysosomes in donor (white) and acceptor (black) neurons. Data are shown as mean ± s.e.m.
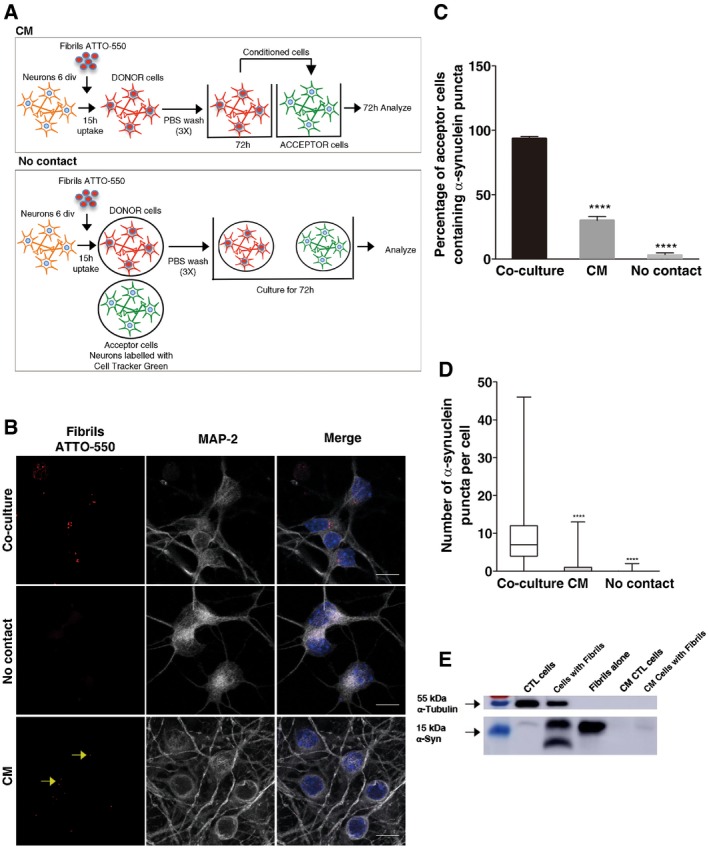
Experimental set‐up used to assay transfer through conditioned medium (upper scheme) and cell‐to‐cell contacts (lower scheme) in neurons. For the CM experiments, donor neurons are loaded with α‐synuclein fibrils for 16 h, washed 3 times with PBS, and then fresh medium is added and left to condition for 72 h. CM is then collected and transferred to acceptor neurons (10 div) for 72 h. In the cell‐to‐cell contact impairment (No contact) experiment, the donor (already loaded) and newly dissected acceptor (already labelled) neurons are plated on different coverslips placed in the same Petri dish. In both experiments, the percentage of cells containing α‐synuclein ATTO‐550 puncta, and the number and mean size of α‐synuclein puncta per cell are quantified using the ICY software after 72 h.
Representative images of acceptor neurons that were either (i) co‐cultured with donor neurons (upper panel, Co‐culture), (ii) physically separated from donor cells (middle panel, No contact) or (iii) cultured with the conditioned medium of donor neurons (bottom panel, CM). In red, α‐synuclein fibrils; in white, acceptor neurons; and in blue, nuclei. Scale bars represent 10 μm. Yellow arrows point to ATTO‐550 α‐synuclein puncta detected in the CM condition.
The bar graph shows the percentage of acceptor cells containing α‐synuclein puncta from images such as those presented in (B). ****P < 0.001 compared to the co‐culture condition by two‐tailed Student's t‐test. Data are shown as mean ± s.e.m. from three independent experiments (where at least 80 cells were counted per experiment).
The box plot shows the number of α‐synuclein puncta in acceptor neurons in co‐culture (white), in CM (grey) and in the No contact condition (light grey). Boxes extend from the first to the third quartile, the line inside the boxes shows the median and the whiskers represent the min/max value of at least 80 cells scored for each independent experiment. ****P < 0.001 compared to the co‐culture condition by two‐tailed Mann–Whitney U‐test (n = 3 independent experiments).
Western blot analysis of α‐synuclein indicates the presence of some α‐synuclein in the CM of neurons loaded with the fibrils after 72 h compared to control medium and to lysate of cells directly exposed to the fibrils. α‐tubulin was used as a loading control.
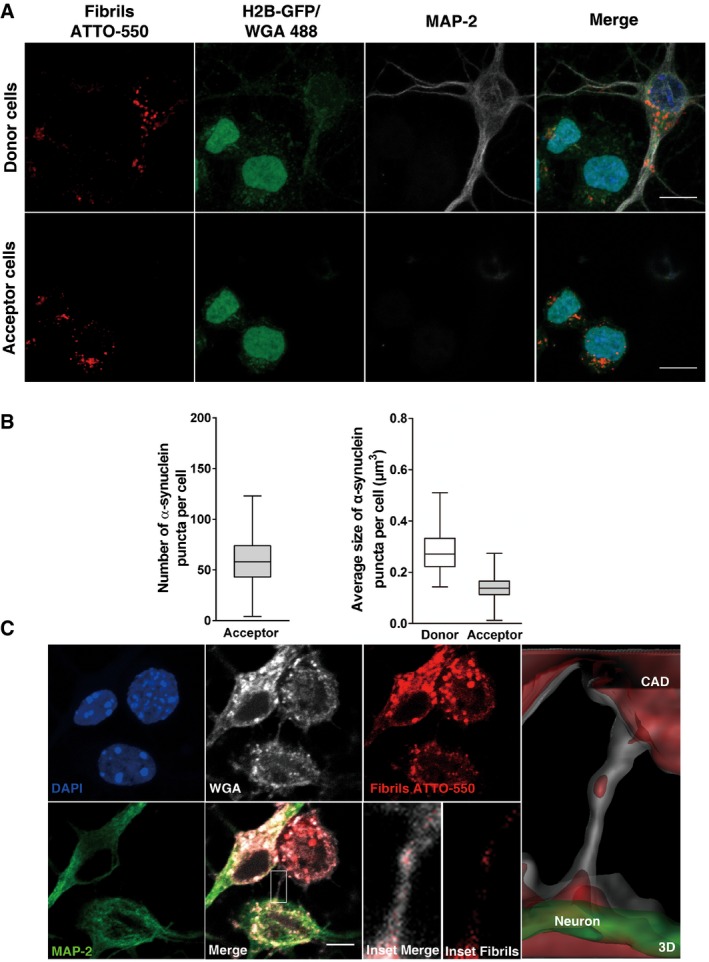
Representative images of donor (upper panel) and acceptor cells (bottom panel) after 24 h of co‐culture. Donor neurons were loaded with α‐synuclein fibrils prior to co‐culture with H2B‐GFP acceptor CAD cells. In red, α‐synuclein puncta; in green, acceptor CAD cells; in white, donor neurons; and in blue, nuclei. The images of donor cells are representative Z‐stack projections of the lower slices where these cells are located, and the images corresponding to acceptor CAD cells are Z‐stack projections of the upper slices, covering the whole cell body. Scale bars represent 10 μm.
Box plots showing the number (left side) and average size (right side) of α‐synuclein puncta in acceptor CAD cells after 24 h of co‐culture with donor neurons. (n=3 independent experiments). In the box and whisker plots, boxes extend from the first to the third quartile, the line inside the boxes shows the median and the whiskers represent the min/max value of at least 80 cells scored for each independent experiment.
Representative images showing a TNT detected between CAD cells and neurons after 24 h of co‐culture. In green, MAP‐2; in white, WGA; in red, α‐synuclein puncta; and in blue, nuclei. The merged image in the bottom panel shows in detail the TNT connecting the cells. The insets and the 3D reconstruction of the neuron (green) and the CAD cell (white) show the presence of α‐synuclein puncta inside the TNT. Scale bar represents 5 μm.
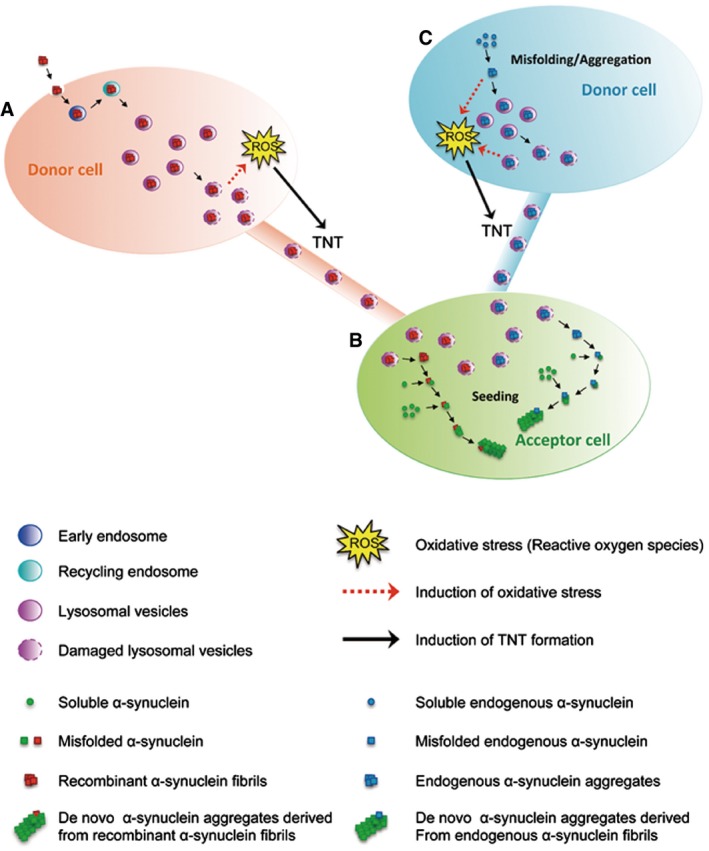
- A–C
Once internalized in donor cells (A), recombinant human α‐synuclein fibrils are mainly targeted to lysosomal vesicles (and found to a lesser extend in early and recycling endosomes). Lysosomal vesicles containing α‐synuclein fibrils transfer from donor to acceptor cells (B) inside TNTs. Once in the acceptor cells, α‐synuclein fibrils induce the formation of de novo α‐synuclein aggregates (seeding). We propose that (A) α‐synuclein fibrils accumulated inside lysosomes would impair their function leading to cellular stress (e.g. oxidative stress). In turn, this would induce TNT formation allowing spread to (B) healthy cells in order to lower the burden of α‐synuclein fibrils inside lysosomes. α‐synuclein fibrils would then escape lysosomes possibly by inducing LMP. Once free in the cytoplasm, they would recruit soluble α‐synuclein and induce de novo formation of α‐synuclein aggregates. As a consequence, α‐synuclein fibrils would propagate from stressed to unstressed cells through TNTs contributing to the intercellular spreading of the pathology. Because endogenous α‐synuclein when aggregated is targeted to lysosomes in vivo, we propose a similar mechanism occurring for endogenously formed aggregates (C).
Comment in
-
Mechanisms of disease: Intracellular tunnels spread disease.Nat Rev Mol Cell Biol. 2016 Oct;17(10):608-9. doi: 10.1038/nrm.2016.124. Epub 2016 Sep 1. Nat Rev Mol Cell Biol. 2016. PMID: 27580842 No abstract available.
-
Alpha-synuclein fibrils propagate through tunneling nanotubes.Mov Disord. 2017 Mar;32(3):394. doi: 10.1002/mds.26909. Epub 2017 Feb 20. Mov Disord. 2017. PMID: 28218419 No abstract available.
References
-
- Abounit S, Zurzolo C (2012) Wiring through tunneling nanotubes–from electrical signals to organelle transfer. J Cell Sci 125: 1089–1098 - PubMed
Publication types
MeSH terms
Substances
LinkOut - more resources
Full Text Sources
Other Literature Sources
