. 2016 Oct 7;291(41):21761-21770.
doi: 10.1074/jbc.M116.719856. Epub 2016 Aug 22.

The Steroid Hormone 20-Hydroxyecdysone Promotes the Cytoplasmic Localization of Yorkie to Suppress Cell Proliferation and Induce Apoptosis

Affiliations

The Steroid Hormone 20-Hydroxyecdysone Promotes the Cytoplasmic Localization of Yorkie to Suppress Cell Proliferation and Induce Apoptosis

Di Wang et al. J Biol Chem. .

Abstract

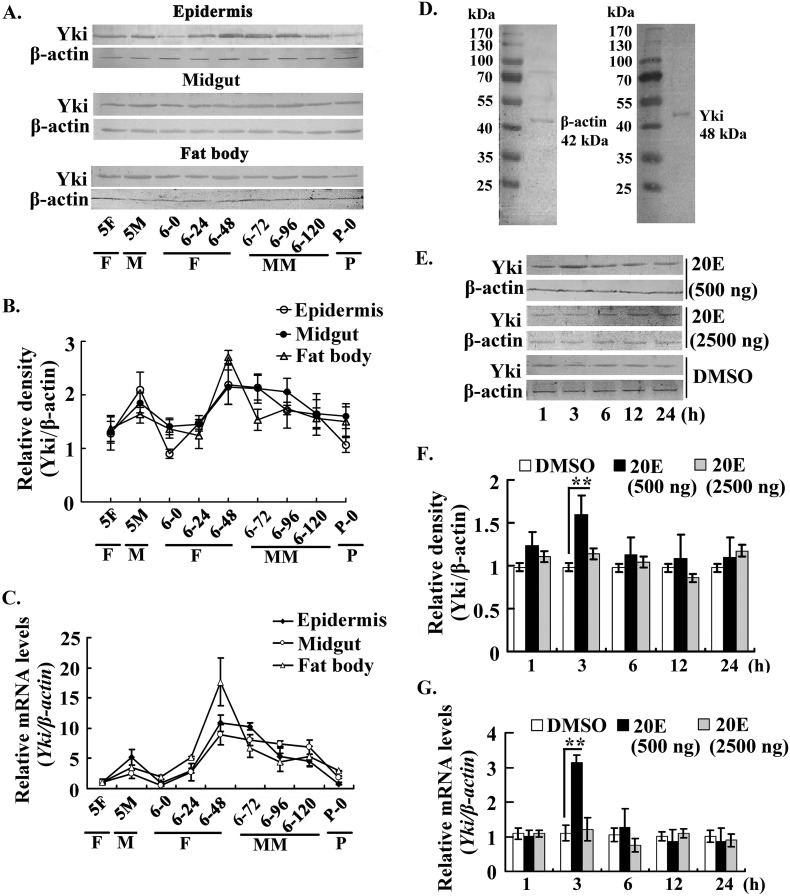
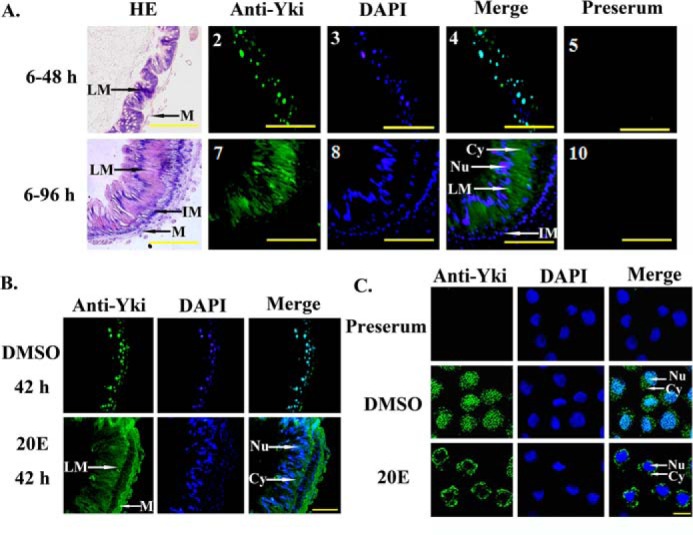
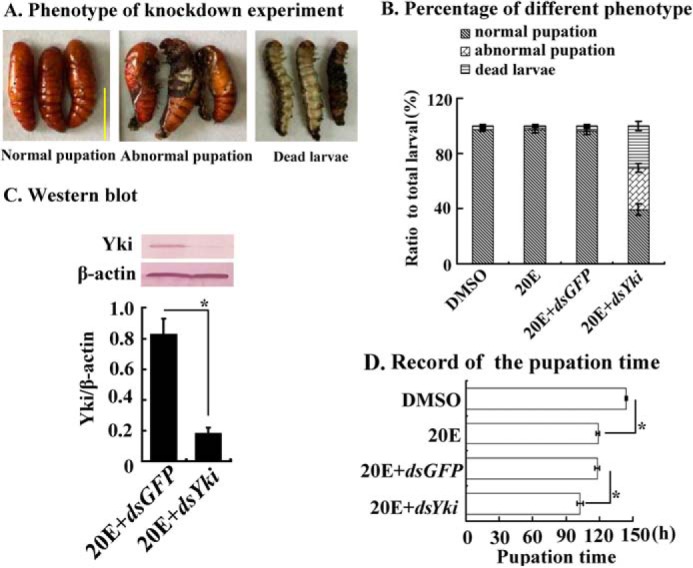
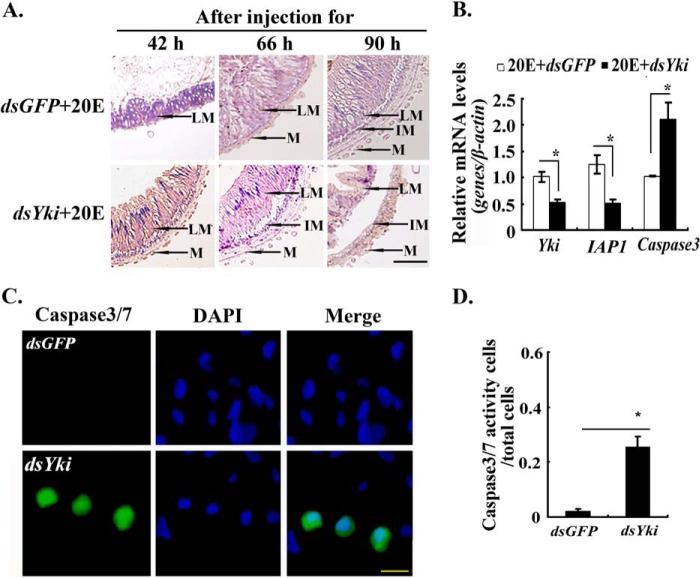
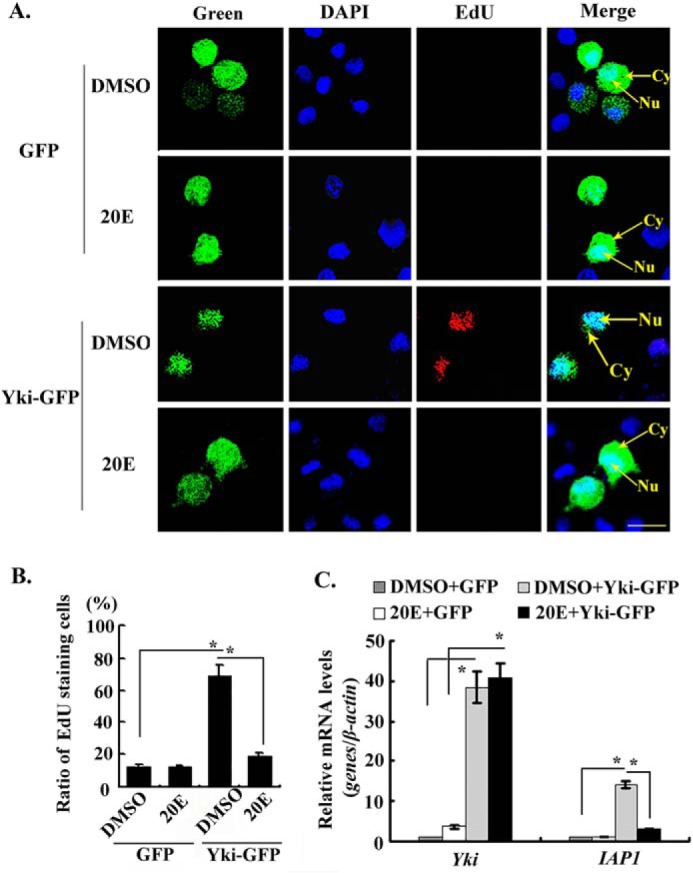
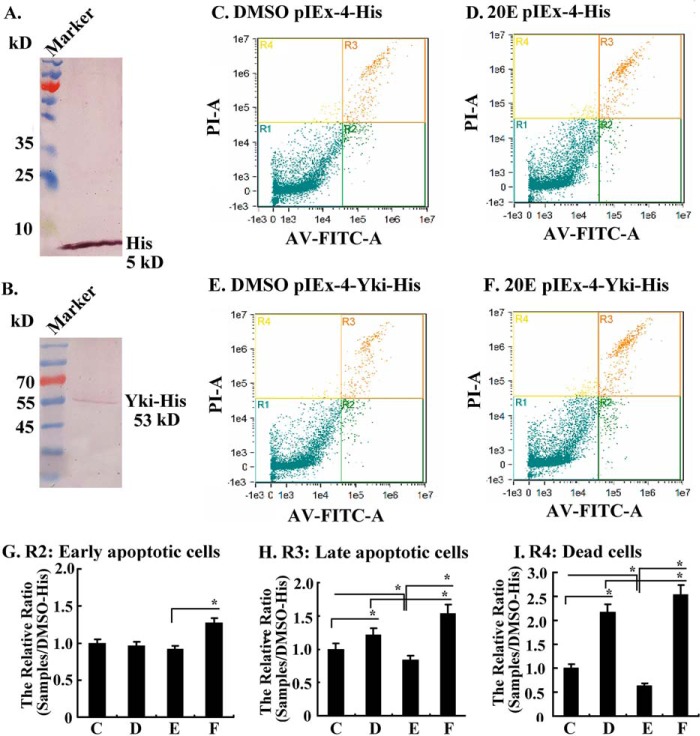
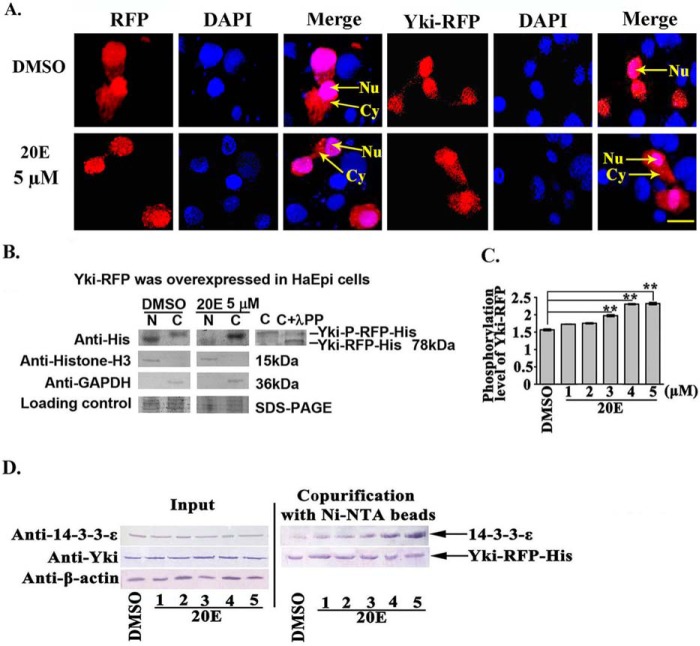
The transcriptional co-activator Yki (Yorkie), a member of the Hippo pathway, regulates cell proliferation or apoptosis, depending on its nuclear or cytoplasmic location. However, the upstream factors regulating the subcellular localization of Yki are unclear. We found that the steroid hormone 20-hydroxyecdysone (20E) induces phosphorylation of Yki, causing it to remain in the cytoplasm, where it promotes apoptosis in the midgut of the lepidopteran insect Helicoverpa armigera Yki is expressed in various tissues, with an increase in the epidermis and midgut during early metamorphic molting. Yki is localized mainly in the nucleus of feeding larval midgut cells but is mainly localized in the cytoplasm of metamorphic molting larval midgut cells. The knockdown of Yki in the feeding larvae promotes larval-pupal transition, midgut programmed cell death, and repressed IAP1 (inhibitor of apoptosis 1) expression. Knockdown of Yki in the epidermal cell line (HaEpi) induced increased activation of Caspase3/7. Overexpressed Yki in HaEpi cells was mainly localized in the nucleus and induced cell proliferation. 20E promotes the cytoplasmic localization of Yki, reducing the expression of the IAP1, resulting in apoptosis. 20E promotes cytoplasmic retention of Yki by increasing Yki phosphorylation levels and promoting the interaction between Yki and the adaptor protein 14-3-3-ϵ. This regulation of Yki suppresses cell proliferation and induces cell apoptosis.

Keywords: 20-hydroxyecdysone; Hippo pathway; Yorkie; apoptosis; cell proliferation; cytoplasmic localization; insect; steroid hormone.


Figures

FIGURE 1.
FIGURE 1.
Expression profile and hormonal regulation of Yki in tissues during larval development. A, Yki expression profiles in the epidermis, midgut, and fat body, as shown by Western blotting using a polyclonal antibody against H. armigera Yki. The gel concentration was 12.5%. 5F, fifth instar feeding; 5M, fifth instar molting; 6-0 to 6-120, sixth instar 0 h to sixth instar 120 h; P-0, pupal stage day 0; F, feeding; M, molting; MM, metamorphic molting; P, pupation. β-actin was used as a quantitative control using an antibody against H. armigera β-actin. B, quantitation of the images of Western blotting from three independent experiments using ImageJ software. C, qRT-PCR detected the mRNA levels of Yki in the epidermis, midgut, and fat body. D, protein ladder (Thermo Fisher Scientific, Lithuania) was used to identify the molecular weight of β-actin and Yki, respectively. The proteins in the midgut were used for Western blotting. The gel concentration was 12.5%. E, effect of 20E on Yki expression. Five μl of 20E (100 ng/μl or 500 ng/μl) was injected into the larval hemocoel of the sixth instar 6-h larvae for different times. An equal volume of diluted DMSO was injected as the control. The proteins in the midgut were detected by Western blotting. The gel concentration was 12.5%. F, the statistical analysis of the pictures in E from three independent experiments using ImageJ software. The values are expressed as the means ± S.D. (n = 3). **, p < 0.01 indicates a significant difference by Student's t test. G, qRT-PCR detected the mRNA levels of Yki after 20E induction. The experimental method was same as with E. β-actin was used as the control. Asterisks indicate significant differences (*, p < 0.05; **, p < 0.01), assessed using Student's t test based on three replicates (n = 3).
FIGURE 2.
FIGURE 2.
Subcellular localization of Yki in the larval midgut and HaEpi cells. A, Yki is located in the cytoplasm during metamorphosis. Panels 1–5, midgut of the sixth instar 48-h (6–48 h) larvae; panels 6–10, midgut of the sixth instar 96 h larvae (6–96 h). HE, HE staining; Anti-Yki, antibody against H. armigera Yki and Alexa 488-labeled goat anti-rabbit secondary antibodies; DAPI, cell nuclei stained with DAPI; Preserum, preimmune serum. LM, larval midgut; IM, imaginal midgut; M, muscle; Cy, cytoplasm; Nu, nucleus. The scale bars represent 50 μm. B, 20E regulated the cytoplasmic location of Yki in larval midgut cells. Five μl of 20E (500 ng/μl) was injected into the sixth instar 6-h larvae for 42 h. The same volume of DMSO was injected as a control. The scale bar represents 50 μm. C, the location of endogenous Yki in HaEpi cells. The final concentration of 20E was 5 μm. An equal volume of DMSO was used as a control. The endogenous Yki was detected using the polyclonal antibody against H. armigera Yki. Anti-Yki, indicates Yki detected by anti-Ha-Yki and Alexa 488-labeled goat anti-rabbit secondary antibodies; DAPI, cell nuclei stained with DAPI. The scale bar represents 25 μm.
FIGURE 3.
FIGURE 3.
Yki knockdown accelerated metamorphosis. Five μl of dsYki and dsGFP (800 ng/μl) were injected separately into the hemocoel of sixth instar 6-h larvae three times at 24-h intervals. In the last injection of dsRNA, 20E (500 ng) was injected into the hemocoel together. A, different phenotypes of Yki knockdown in larvae. The scale bar indicates 1 cm. B, percentages of the different phenotypes in A. C, Western blotting revealed the efficiency of Yki knockdown. Protein was extracted from midgut at the sixth instar 72 h. The gel concentration was 12.5%. β-actin was used as the control. The image data were processed by ImageJ software. The values are expressed as the means ± S.D. (n = 3). D, pupation time following Yki knockdown. The asterisks denote significant differences (0.01 < p < 0.05, via Student's t test) (3 × 30 larval samples).
FIGURE 4.
FIGURE 4.
Yki knockdown accelerated midgut apoptosis. A, midgut morphology after dsYki or dsGFP injection as detailed in Fig. 3. LM, larval midgut; IM, imaginal midgut; M, muscle. The scale bar represents 50 μm. B, qRT-PCR showing the mRNA levels of IAP1 and Caspase3 after dsYki injection for 66 h in larval midgut in the above treatment. β-actin was used as the control. The asterisks denote significant differences (0.01 < p < 0.05, via Student's t test) based on three replicates. C, Yki knockdown increased Caspase3/7 activity in HaEpi cells. Caspase3/7 activity was detected in dsGFP and dsYki cells (dsRNA 2 μg/ml). Green fluorescence represents the Caspase3/7 activity, as assessed using a Caspase3/7 activity detection kit. Blue fluorescence indicates DAPI-stained nuclei. “Merge” is the superimposed images of the green and blue fluorescence. Fluorescence was observed using an Olympus 257 BX51 fluorescence microscope. The scale bar represents 25 μm. D, statistical analyses of the ratio of Caspase3/7 activity cells in the total cells by ImageJ software. The values are expressed as the means ± S.D. (n = 3). The asterisks indicate significant difference calculated by Student's t test from three independent experiments.
FIGURE 5.
FIGURE 5.
20E suppressed the proliferation function of Yki. A, the overexpression of GFP-His and Yki-GFP-His in HaEpi cells and detection of cell proliferation by EdU. Green, GFP-His and Yki-GFP-His. 20E (5 μm) treated cells for 24 h. The same volume of DMSO was used as the control. Blue, nucleus stained with DAPI; red, EdU; Merge, the overlapped red, green, and blue. Bar, 20 μm. B, statistical analysis of the percentage of EdU staining cells in various treatments using ImageJ software. The values are expressed as the means ± S.D. (n = 3). The asterisks indicate significant differences between the groups (p < 0.05). Student's t test was based on three independent experiments. C, detection of the expression level of IAP1 in various treatments by qRT-PCR. The asterisks indicate significant differences calculated by Student's t test from three independent experiments.
FIGURE 6.
FIGURE 6.
20E suppressed Yki function to induce cell apoptosis, as detected by Amnis flow cytometry. A and B, Western blotting showing the overexpression of His tag and Yki-His in HaEpi cells. C and D, His tag expressing cells induced with DMSO or 20E (5 μm) for 72 h in Grace's medium, respectively. E and F, Yki-His expressing cells induced with DMSO or 20E (5 μm) for 72 h in Grace's medium, respectively. AV-FITC-V, annexin V-FITC to detect the early apoptotic cells; PI-A, propidium iodide (PI) to detect the late apoptotic cells; R1, living cells (PI-negative, FITC-negative); R2, early apoptotic cells (PI-negative, FITC-positive); R3, late apoptotic cells (PI-positive, FITC-positive); R4, dead cells (PI-positive, FITC-negative). G–I, statistics of cells in R2, R3, and R4 from C–F. The values are expressed as the means ± S.D. (n = 3). The asterisks indicate significant differences (*, p < 0.05; **, p < 0.01) via Student's t test based on three replicates.
FIGURE 7.
FIGURE 7.
20E arrested Yki in the cytoplasm by regulating Yki phosphorylation and interaction with 14-3-3-ϵ. A, the location of Yki-RFP-His in HaEpi cells. Red fluorescence represents RFP and the recombinant protein annexin-RFP, whereas blue represents DAPI-stained nuclei. Merge shows the superimposed red and blue fluorescence. Nu, nucleus; Cy, cytoplasm. The pictures were obtained after 6 h of 20E (5 μm) incubation; DMSO was used as the solvent control. Pictures were taken using a Zeiss LSM 700 laser confocal microscope. The scale bar represents 20 μm. B, Western blotting analysis of Yki-RFP-His expression in the cytoplasm and nucleus following pIEx-Yki-RFP-His overexpression. The gel concentration was 7.5%. N, nucleus; C, cytoplasm. λPP, λ-phosphatase. Anti-histone-H3 and anti-GAPDH were used to control the separation of the cytoplasmic and nuclear proteins, respectively. Loading control indicated the quantity of the protein loading. C, Yki phosphorylation levels detected using a phosphoprotein phosphate estimation kit. The cells were treated with 20E (1–5 μm) for 6 h. The error bars represent the standard deviations of three replicates. The asterisks denote significant differences (p < 0.01, via Student's t test). D, interaction between Yki and 14-3-3-ϵ (30 kDa). Input, protein expression levels of 14-3-3-ϵ and Yki-RFP-His in the cell lysates after various treatments. The co-purified 14-3-3-ϵ was detected using a rabbit antiserum against Helicoverpa 14-3-3-ϵ prepared in our laboratory. β-actin was used as the quantitative control.

References

    1. Moroishi T., Hansen C. G., and Guan K. L. (2015) The emerging roles of YAP and TAZ in cancer. Nat. Rev. Cancer 15, 73–79 - PMC - PubMed
    1. Huang J., Wu S., Barrera J., Matthews K., and Pan D. (2005) The Hippo signaling pathway coordinately regulates cell proliferation and apoptosis by inactivating Yorkie, the Drosophila homolog of YAP. Cell 122, 421–434 - PubMed
    1. Dong J., Feldmann G., Huang J., Wu S., Zhang N., Comerford S. A., Gayyed M. F., Anders R. A., Maitra A., and Pan D. (2007) Elucidation of a universal size-control mechanism in Drosophila and mammals. Cell 130, 1120–1133 - PMC - PubMed
    1. Zhang L., Ren F., Zhang Q., Chen Y., Wang B., and Jiang J. (2008) The TEAD/TEF family of transcription factor Scalloped mediates Hippo signaling in organ size control. Dev. Cell 14, 377–387 - PMC - PubMed
    1. Oh H., and Irvine K. D. (2008) In vivo regulation of Yorkie phosphorylation and localization. Development 135, 1081–1088 - PMC - PubMed

MeSH terms

LinkOut - more resources