. 2016 Sep 6;113(36):9983-8.
doi: 10.1073/pnas.1606915113. Epub 2016 Aug 22.

Biophysical insight into mechanisms of sonoporation

Affiliations

Biophysical insight into mechanisms of sonoporation

Brandon Helfield et al. Proc Natl Acad Sci U S A. .

Abstract

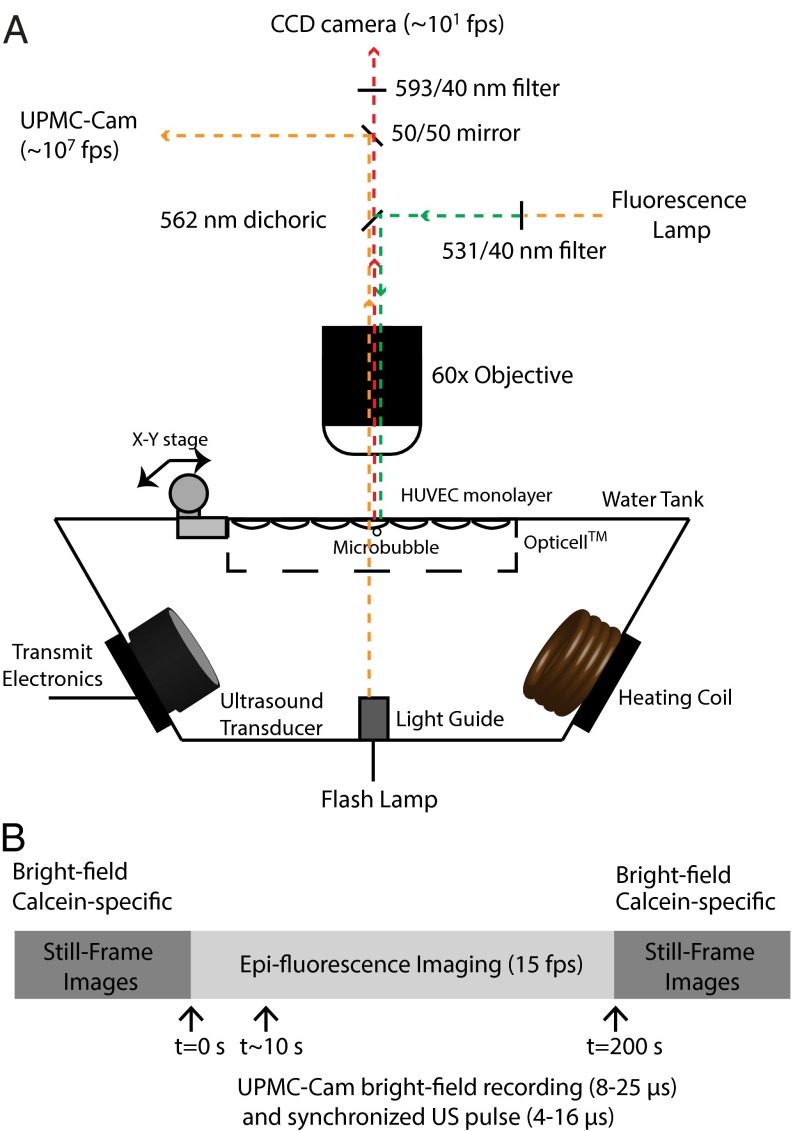
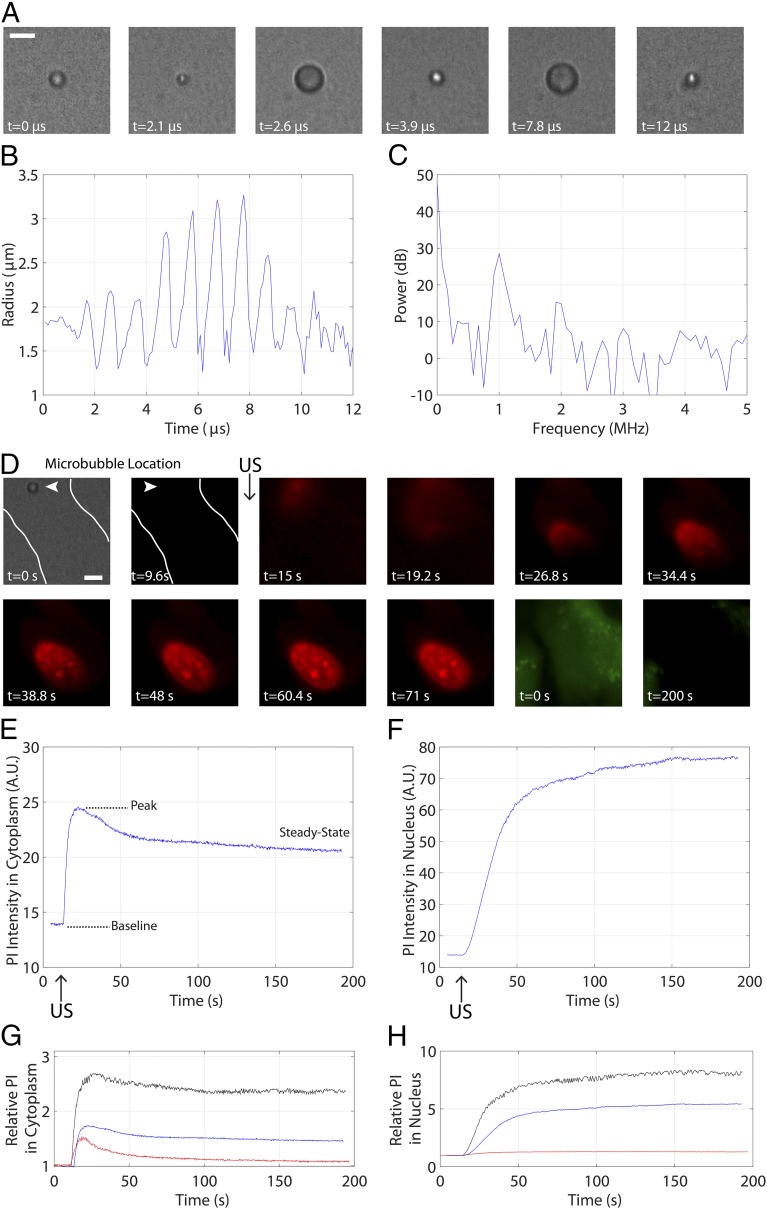
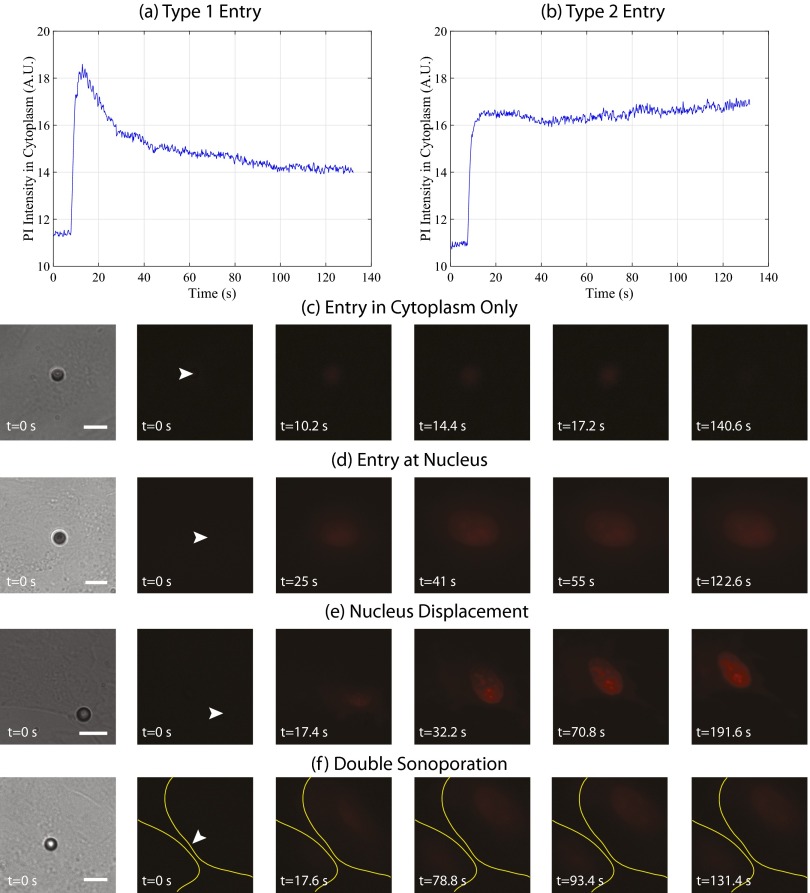
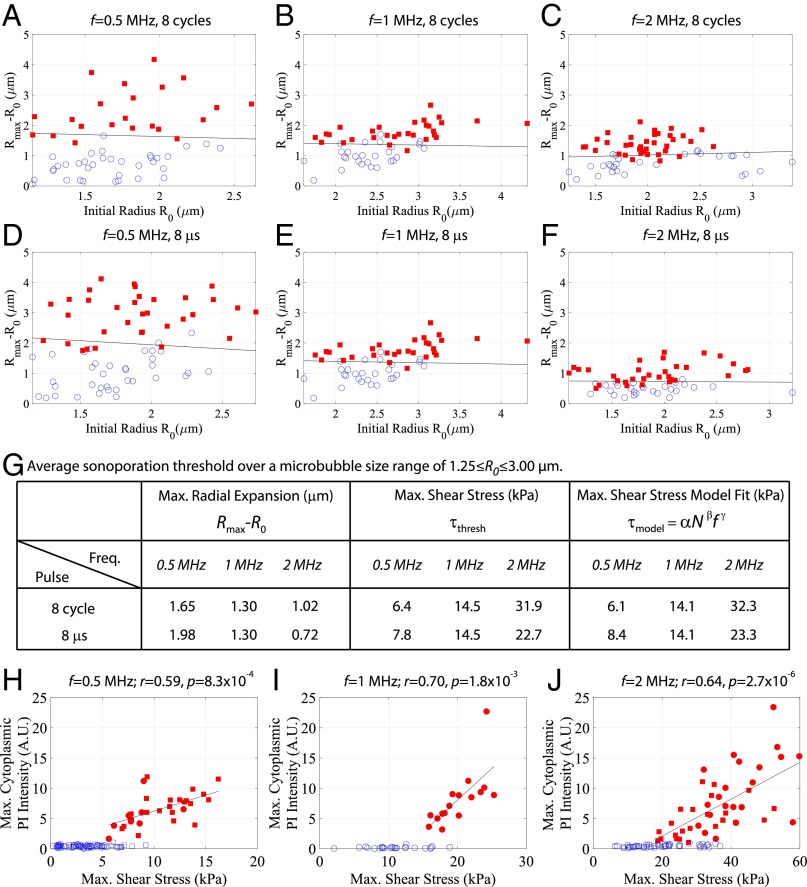
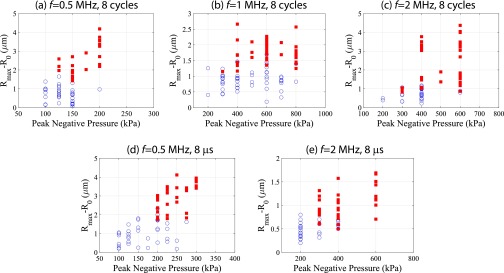
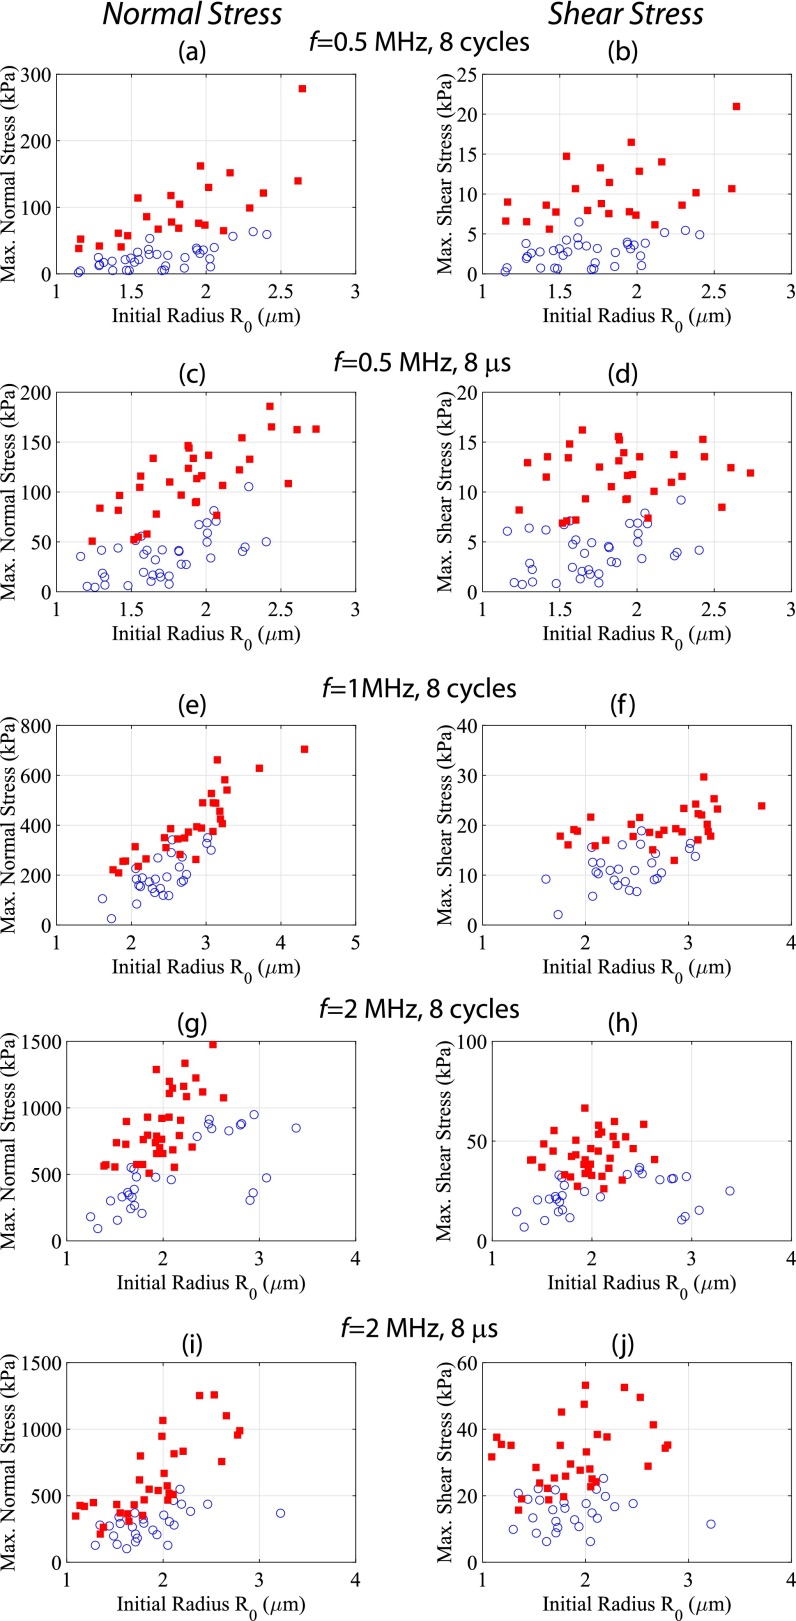
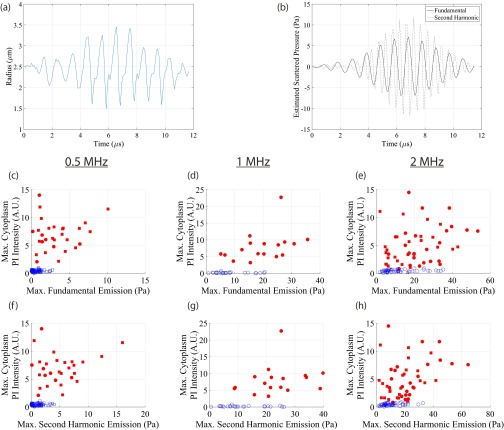
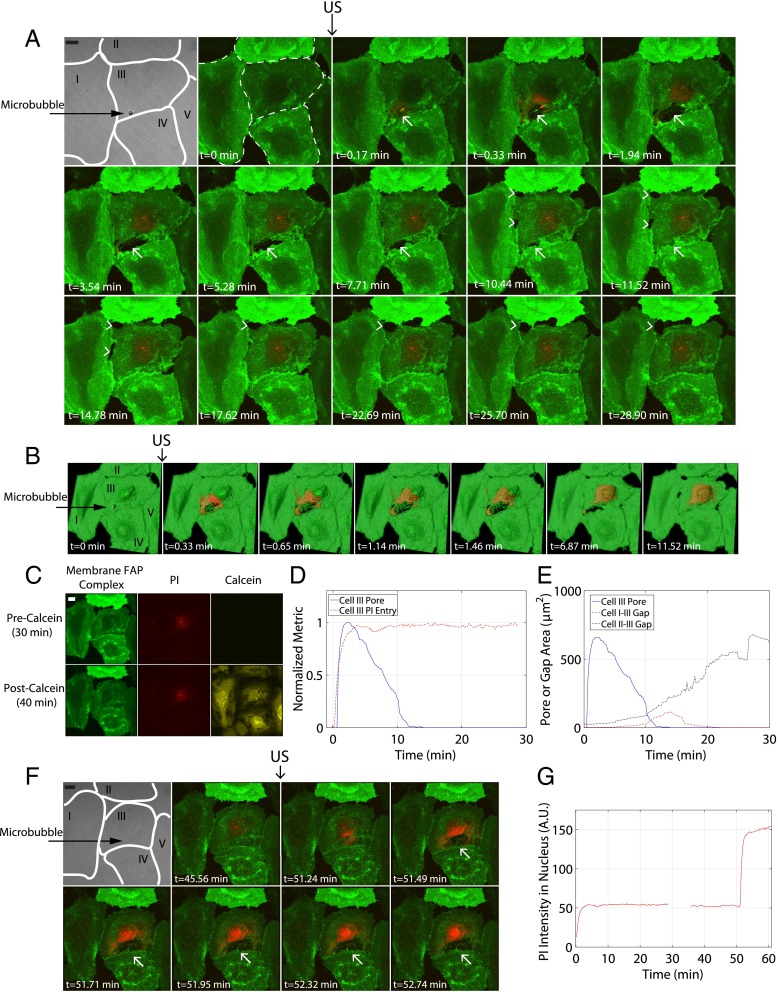
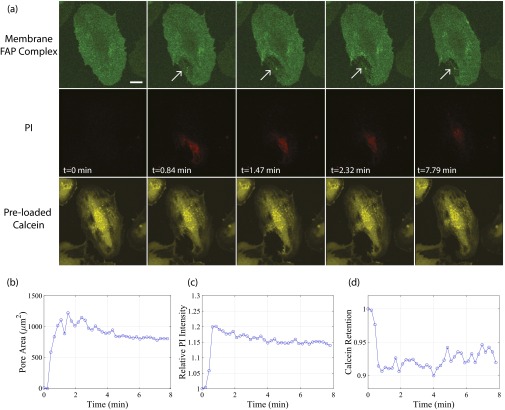
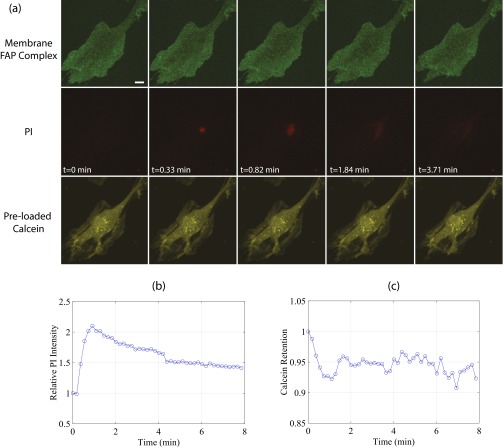
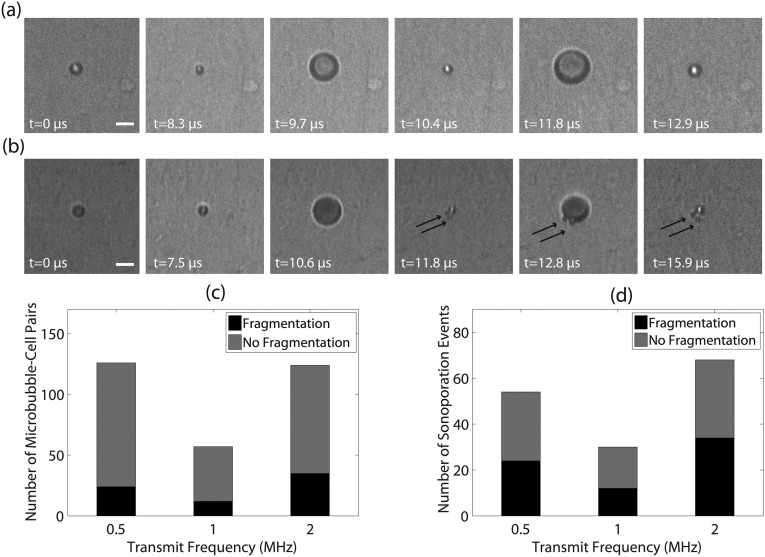
This study presents a unique approach to understanding the biophysical mechanisms of ultrasound-triggered cell membrane disruption (i.e., sonoporation). We report direct correlations between ultrasound-stimulated encapsulated microbubble oscillation physics and the resulting cellular membrane permeability by simultaneous microscopy of these two processes over their intrinsic physical timescales (microseconds for microbubble dynamics and seconds to minutes for local macromolecule uptake and cell membrane reorganization). We show that there exists a microbubble oscillation-induced shear-stress threshold, on the order of kilopascals, beyond which endothelial cellular membrane permeability increases. The shear-stress threshold exhibits an inverse square-root relation to the number of oscillation cycles and an approximately linear dependence on ultrasound frequency from 0.5 to 2 MHz. Further, via real-time 3D confocal microscopy measurements, our data provide evidence that a sonoporation event directly results in the immediate generation of membrane pores through both apical and basal cell membrane layers that reseal along their lateral area (resealing time of ∼<2 min). Finally, we demonstrate the potential for sonoporation to indirectly initiate prolonged, intercellular gaps between adjacent, confluent cells (∼>30-60 min). This real-time microscopic approach has provided insight into both the physical, cavitation-based mechanisms of sonoporation and the biophysical, cell-membrane-based mechanisms by which microbubble acoustic behaviors cause acute and sustained enhancement of cellular and vascular permeability.

Keywords: endothelial membrane; gene delivery; microbubble contrast agent; sonoporation; ultrasound therapy.


Conflict of interest statement

The authors declare no conflict of interest.

Figures

Fig. 1.
Fig. 1.
Simultaneous ultrafast bright-field (Mfps) and slow-speed epifluorescence (fps) microscopy bridges observations over 6 orders of magnitude in time. (A) A schematic cross-section of a custom-designed water tank, housing a single-element transducer and a coil heater, mounted on a microscope stage. The light collected from the objective lens was split with a 50/50 mirror to two detectors––the UPMC-Cam (26) and a CCD camera used for epifluorescence microscopy. To ensure simultaneous fluorescence recording before, during, and after ultrasound exposure, the appropriate filter cube was decomposed to leave the dichroic mirror in the beam path. The emission filter was placed downstream of the beam-splitting mirror to ensure that a sufficient amount of photons from the flash lamp reached the UPMC-Cam detectors. (B) Synchronous triggering between the ultrasound transducer and ultrafast microscopy system was achieved to collect an ultrafast frame rate bright-field recording of microbubble behavior (∼8–25 µs), a fluorescence video recording of the corresponding PI uptake before, during, and after ultrasound transmission (∼2–3 min), and a set of bright-field and calcein pre- and postultrasound still frames. The UPMC-Cam (26), currently the only imaging system of its kind in North America, is based on a rotating mirror framing camera. A mirror prism, rotated by a gas (helium) turbine, achieves up to 20,000 rotations per second to direct the incoming photons through a bank of relay lenses and beam splitters, projecting two images on a single CCD camera. This optical system therefore results in 128 temporally separated images (1,360 × 1,024 pixels) spatially projected onto 64 CCD cameras at a maximum of 25 Mfps.
Fig. 2.
Fig. 2.
Individual ultrasound-stimulated microbubble oscillation increases endothelial membrane permeability. (A) Select frames from an ultrahigh-speed recording from the UPMC-Cam at 10.86 Mfps, highlighting microbubble spherical oscillation at 1 MHz and 0.8 MPa. (Scale bar, 5 µm.) (B) Quantification of the radial profile of the microbubble shown in A over time and (C) corresponding radial power spectrum as extracted from the UPMC-Cam bright-field recording. This microbubble exhibits some gas loss due to ultrasound (US) exposure, resulting in a slightly smaller size (1.4-µm radius) by the end of the US pulse and up to 3 min thereafter. (D) Simultaneous epifluorescence imaging before, during, and after US delivery highlights the uptake of a normally cell-impermeable model drug PI (red). The first two frames depict the microbubble–cell geometry (white lines denote cell contours and arrowheads denote microbubble location) in bright-field and epifluorescence frames, respectively. Frames 3–10 demonstrate PI uptake after US delivery. The commencement of PI uptake is spatially localized to the position of bubble–cell contact (arrowhead), entering the cytoplasm and continuing to diffuse within the nucleus. Frames 11 and 12, taken during calcein-specific imaging (green) before US (frame 11) and about 200 s later (frame 12), illustrate that calcein is lost during this sonoporation process. (Scale bar, 5 µm.) Note the characteristic differences in PI uptake dynamics within (E) the cytoplasm and (F) the nucleus, likely related to the diffusion physics of these two cellular compartments. The cytoplasmic PI profile is consistent with the arrest of PI entry within the cell (e.g., pore resealing, PI saturation), whereas the monotonically increasing, plateau-like nature of the nuclear PI reflects the immobile nature of the DNA within the nuclear cavity. (G and H) The range of PI uptake curves exhibited by all microbubbles interrogated at 1 MHz. These curves are normalized to their respective baseline-subtracted values. See Movies S1 and S2.
Fig. S1.
Fig. S1.
Heterogeneous uptake dynamics and qualitative sonoporation response. The dynamics of PI entry exhibit two distinct behaviors, reaching a maximum value and (A) returning to a steady-state value or (B) remaining at maximum signal intensity. In the following panels, the first frame depicts the pre-US delivery bright-field image, illustrating the microbubble–cell positioning. In the second frame, the white arrowhead denotes the microbubble location before US delivery. Indeed, epifluorescence microscopy highlights a spectrum of qualitative sonoporation events, including (C) the immediate entry of PI restricted to the cytoplasm, resulting in no nuclear staining, and (D) direct entry within the nucleus, dictated in part by the specific microbubble location relative to the nucleus. Furthermore, (E) significant nucleus displacement as a function of recording time post-US exposure was observed, as well as (F) an individual microbubble causing sonoporation of two adjacent cells (yellow lines denote cell boundaries). (Scale bar, 10 µm.) See Table S1.
Fig. 3.
Fig. 3.
Microbubble-generated shear stress is a mechanistic threshold indicator for sonoporation, resulting in a commensurate increase in macromolecule influx within endothelial cells. (AF) The effect of US frequency and pulse duration on sonoporation. Two frequency-dependent studies were performed; with either the number of cycles (8 cycles; AC) or the pulse time duration (8 µs; DF) held constant (i.e., five independent conditions). Red squares denote microbubble–cell pairs that exhibited PI uptake (sonoporation), whereas blue circles denote no PI entry. RmaxR0 indicates the maximum absolute microbubble shell excursion during US exposure measured from the ultrafast recordings (y axis), and is plotted against initial microbubble radius R0. Peak negative acoustic pressures ranged from 0.1 to 0.4 MPa, 0.2 to 0.8 MPa, and 0.2 to 0.6 MPa for 0.5 MHz, 1 MHz and 2 MHz, respectively, to build up this physically relevant parameter space. The threshold in absolute microbubble excursion above which sonoporation occurs as a function of initial radius was determined through linear discriminant analysis (solid line), resulting in an approximately constant relation. (G) Sonoporation thresholds averaged over a microbubble size range of 1.25 ≤R0 ≤ 3.00 µm for the US frequencies and pulse durations tested. To model the maximum shear-stress threshold, a materials engineering approach was adopted of the form τmodel=αNβfγ, where α = 37.4 ± 2.1, β = -0.47 ± 0.03, and γ = 1.195 ± 0.005 are the fitted parameters. (HJ) Correlation between maximum PI signal intensity (baseline subtracted) at the site of entry (within cytoplasm) and the maximum shear stress for the 8-cycle (circles) and 8-µs (squares) transmit pulses. Red symbols denote microbubble–cell pairs that exhibited PI uptake, whereas blue symbols denote no PI entry. These data indicate that larger shear forces result in either larger pores or longer pore durations. Pearson correlation coefficients and significance are shown.
Fig. S2.
Fig. S2.
Absolute maximum radial excursion is an indicator for sonoporation. In these panels, a closed square denotes sonoporation of the cell in contact with the microbubble (i.e., PI uptake) and an open circle denotes no sonoporation. The range of resulting excursions for a given pressure is due in part to microbubble size (resonance effects) and intrinsic variations in microbubble encapsulation uniformity.
Fig. S3.
Fig. S3.
Sonoporation results when oscillating microbubbles exert shear stresses on HUVECs above a critical threshold. The estimated maximum normal (Left) and shear (Right) stresses from Eqs. S1 and S2 for all interrogated microbubbles. In these panels, a closed square denotes sonoporation of the cell in contact with the microbubble (i.e., PI uptake) and an open circle denotes no sonoporation. The estimated maximum normal stresses exhibit a linear dependence, i.e., larger bubbles requiring a larger normal stress to elicit sonoporation. The maximum shear-stress estimates, however, exhibit an approximately constant threshold over which sonoporation occurs––suggesting a potential mechanism for increases in cell membrane permeability.
Fig. S4.
Fig. S4.
Estimated scattered emissions do not directly correlate with sonoporation propensity. (A) Individual measured microbubble radial response from a single 1-MHz, 8-cycle pulse at 0.7 MPa. (B) Estimated scattered emissions, according to Eq. S3, with filtered fundamental (1 MHz; solid line) and second-harmonic (2 MHz; dashed line) response. (CH) Maximum PI signal intensity (baseline subtracted) at the site of entry (within cytoplasm) as a function of maximum emission for the 8-cycle (circles) and 8-µs (squares) transmit pulses. Red symbols denote microbubble–cell pairs that exhibited PI uptake, whereas blue symbols denote no PI entry. Unlike its shear-stress analog (Fig. 3 HJ), there is no direct, mechanistic correlation between sonoporation and scattered emissions. This highlights the physical, mechanical origin of sonoporation: namely the exertion of localized, high-magnitude (kilopascal), short-lived (approximately microsecond) shear stress.
Fig. 4.
Fig. 4.
A single sonoporation event results in pore generation that reseals along its lateral area, as well as generates intercellular gaps between adjacent confluent HUVECs that persist over longer timescales. (A) Maximum intensity projections from a 30-min recording of an individual 6.2-µm-diameter microbubble adjacent to a confluent HUVEC monolayer, insonicated with a single pulse (8 µs in duration). The first two frames depict five confluent cells (numbered I through V) pre-US delivery, with the cell borders outlined in white and the microbubble location indicated by a black arrow. Cell membranes have been fluorescently labeled (green) with a FAP complex (SI Methods). Membrane perforation (white arrow) is immediately generated at the point of bubble–cell contact (cell III), concurrent with the entry of PI (red) at the site of the pore. Note the trailing edge of PI as it diffuses away from the pore and accumulates at the nucleus, indicating no further entry despite the apparent persistence of the pore itself (e.g., at 1.94 min). Gaps (arrowheads) between cell III (the directly sonoporated cell) and cells I and II (nonsonoporated cells) form minutes after US transmission and are dynamic throughout the 30-min recording. (B) Surface rendering of the same sonoporation event, highlighting the appearance of multiple, circular pores (at 0.33–1.46 min) followed by coalescence into a larger pore area (at 6.87min) and the trailing edge of PI entry. (C) Cell viability assay [calcein-AM (yellow) added 30 min after US], confirming that the cells shown in A and B remain viable at 40-min post-US. (Upper) Cells before and (Lower) after staining with calcein, respectively. (D) Quantification of PI in cell III over time (red line), highlighting the cessation of PI uptake despite the persistence of a large pore (blue line). (E) Comparison between the time course for the directly sonoporated pore and the indirectly generated gaps between cells I–III and II–III. The generation of gaps between adjacent cells occurs minutes after US transmission and can remain open for at least tens of minutes, suggesting a mechanism for extraluminal drug delivery and prolonged, enhanced vascular permeability. (F) The initiation of a second sonoporation event on cell III with an individual microbubble, resulting in the generation of a new membrane pore (white arrow) and further PI uptake (G), confirming that PI–nucleic acid interactions had not been previously saturated. This confirms that a single-pulse sonoporation event (AE) can result in a resealable membrane pore from which the cell can survive. Although the membrane pore eventually reseals in-plane (∼12 min), the cessation of PI uptake occurs significantly earlier (<2 min), suggesting that out-of-plane membrane sealing between apical and basal sides of the cell (i.e., lateral surface area of pore) is responsible for the termination of extracellular marker/drug entry (D). (Scale bar, 20 µm.) See Movies S3 and S4.
Fig. S5.
Fig. S5.
Membrane pores can reseal along their lateral surface area. (A) Selected frames of a maximum intensity projection of a real-time 3D confocal microscopy recording of sonoporation, highlighting the cell membrane (green, first row), PI (red, second row), and preloaded calcein-AM (yellow, third row) channels. Sonoporation induces a large pore (arrow) in the cell membrane which results in the immediate uptake of PI. Preloaded volume dye calcein-AM indicates that intracellular content loss is minimal after the immediate sonoporation event. (B) Membrane perforation persists at the 8-min time point, despite (C) an arrest in PI uptake and (D) the cessation of intracellular calcein loss at ∼1 min post-US delivery. US: A single, 8-cycle Tukey-windowed pulse at 1 MHz and 200 kPa delivered to a 4-µm-diameter bubble. (Scale bar, 20 µm.)
Fig. S6.
Fig. S6.
US-stimulated microbubbles can generate submicrometer pores. (A) Selected maximum intensity projections from a real-time 3D confocal microscopy recording of sonoporation, highlighting the cell membrane (green, first row), PI (red, second row), and preloaded calcein-AM (yellow, third row) channels. Despite no detectable membrane pore and minimal calcein loss, a marked increase in local PI concentration is observed at the site of bubble–cell contact. (B) Quantification of PI and (C) intracellular calcein loss. US: A single, 8-cycle Tukey-windowed pulse at 1 MHz and 300 kPa delivered to a 3-µm-diameter bubble. (Scale bar, 20 µm.)
Fig. S7.
Fig. S7.
Sonoporation can be achieved through intact microbubble oscillations or through microbubble fragmentation. (A) Stable, large-amplitude microbubble vibration and (B) violent cavitation phenomena, for example microbubble fragmentation (in this example producing n = 2 daughter bubbles as demarcated by the black arrows) can both induce cellular sonoporation. These microbubbles were interrogated at 0.5 MHz and recorded with a frame rate of ∼5.07 MHz. Transmit pressures were 200 kPa and 150 kPa, respectively. (Scale bar, 5 µm.) (C) Intact microbubble oscillations were more frequently observed, and contributed to ∼50% of all sonoporation events independent of transmit frequency (D).

References

    1. Otake K, Ennist DL, Harrod K, Trapnell BC. Nonspecific inflammation inhibits adenovirus-mediated pulmonary gene transfer and expression independent of specific acquired immune responses. Hum Gene Ther. 1998;9(15):2207–2222. - PubMed
    1. Verma IM, Somia N. Gene therapy -- promises, problems and prospects. Nature. 1997;389(6648):239–242. - PubMed
    1. Al-Dosari MS, Gao X. Nonviral gene delivery: Principle, limitations, and recent progress. AAPS J. 2009;11(4):671–681. - PMC - PubMed
    1. Mehier-Humbert S, Guy RH. Physical methods for gene transfer: Improving the kinetics of gene delivery into cells. Adv Drug Deliv Rev. 2005;57(5):733–753. - PubMed
    1. Varkouhi AK, Scholte M, Storm G, Haisma HJ. Endosomal escape pathways for delivery of biologicals. J Control Release. 2011;151(3):220–228. - PubMed

Publication types