. 2016 Sep 19;213(10):1951-9.
doi: 10.1084/jem.20160486. Epub 2016 Aug 22.

MHC II+ resident peritoneal and pleural macrophages rely on IRF4 for development from circulating monocytes

Affiliations

MHC II+ resident peritoneal and pleural macrophages rely on IRF4 for development from circulating monocytes

Ki-Wook Kim et al. J Exp Med. .

Abstract

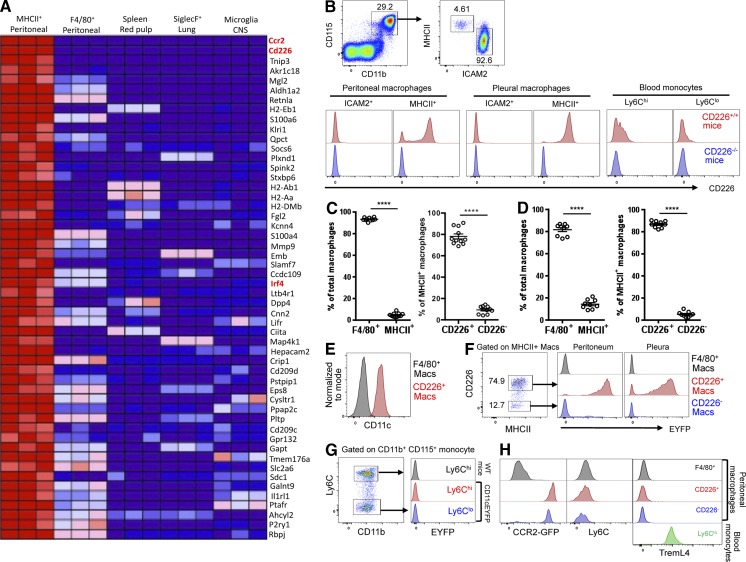
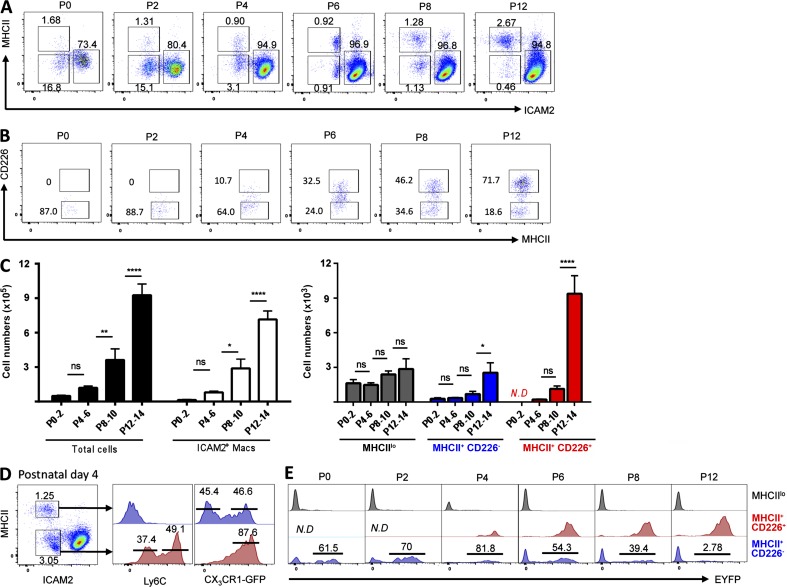
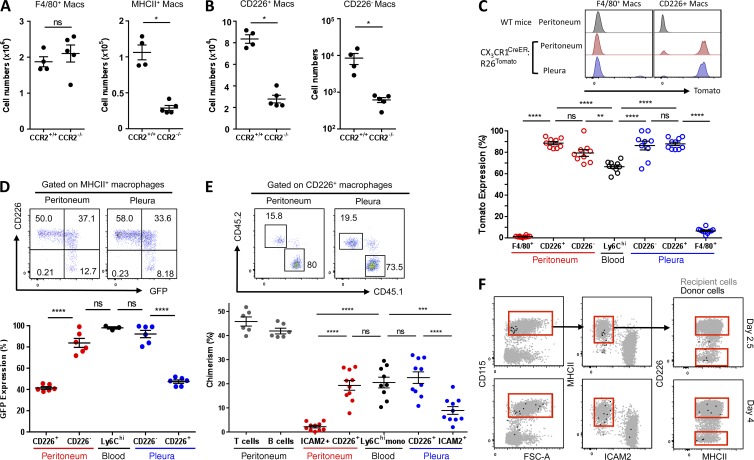
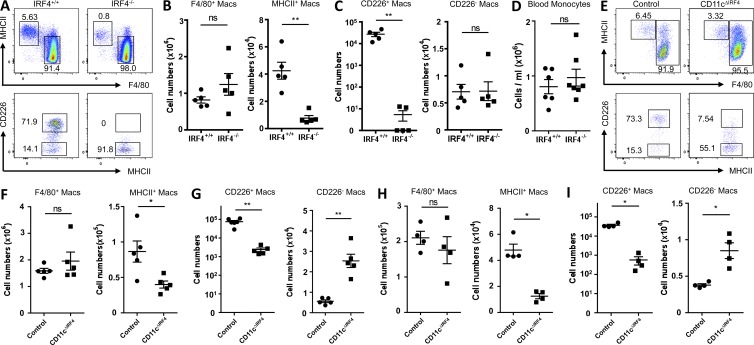
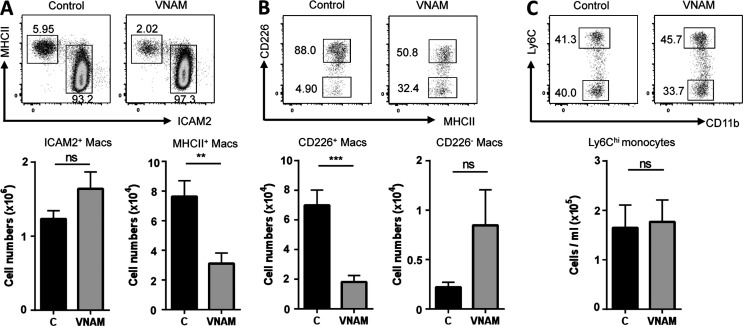
Peritoneal and pleural resident macrophages in the mouse share common features and in each compartment exist as two distinct subpopulations: F4/80(+) macrophages and MHC II(+) CD11c(+) macrophages. F4/80(+) macrophages derive from embryonic precursors, and their maintenance is controlled by Gata6. However, the origin and regulatory factors that maintain MHC II(+) macrophages remain unknown. Here, we show that the MHC II(+) macrophages arise postnatally from CCR2-dependent precursors that resemble monocytes. Monocytes continuously replenish this subset through adulthood. Gene expression analysis identified distinct surface markers like CD226 and revealed that the transcription factor IRF4 was selectively expressed in these macrophages relative to other organs. Monocytes first entered peritoneal or pleural cavities to become MHC II(+) cells that up-regulated CD226 and CD11c later as they continued to mature. In the absence of IRF4 or after administration of oral antibiotics, MHC II(+)CD226(-)CD11c(-) monocyte-derived cells accumulated in peritoneal and pleural cavities, but CD11c(+) CD226(+) macrophages were lost. Thus, MHC II(+) resident peritoneal and pleural macrophages are continuously replenished by blood monocytes recruited to the peritoneal and pleural cavities constitutively, starting after birth, where they require IRF4 and signals likely derived from the microbiome to fully differentiate.


Figures

Figure 1.
Figure 1.
MHC II+ macrophages divide into CD226+ and CD226 subpopulations in peritoneum and pleura. (A) Heat map depicts mean expression intensity of mRNA transcripts for genes differentially expressed between MHC II+ peritoneal macrophages and other macrophages. Transcripts highlighted in red text are those studied in this body of work. Cut-off for depiction includes transcripts expressed more than fivefold in MHC II+ versus F4/80+ ICAM2+ peritoneal macrophages. (B) Gating strategy used for identification of peritoneal macrophages (top dot plot panels) and histograms of CD226 expression on F4/80+ ICAM2+ and MHC II+ macrophages or blood monocytes (bottom panels). (C and D) Quantification of macrophages in B in peritoneum (C) or pleural cavity (D). Data are combined from three independent experiments (n = 9–11, mean ± SEM). P-values, unpaired Student’s t test: ****, P < 0.0001. (E) CD11c expression on peritoneal F4/80+ and CD226+ macrophage subpopulations. (F and G) EYFP expression in CD11c-EYFP mice within MHC II+ macrophage subpopulations in peritoneum and pleura (F) or within blood monocytes (G). Data are representative of at least three independent experiments. (H) CCR2-GFP, Ly6C, and TremL4 expression in peritoneal macrophage subpopulations or Ly6Clo blood monocytes. Data are representative of three independent experiments.
Figure 2.
Figure 2.
CD226+ macrophages develop after birth. (A and B) Peritoneal cells after pregating CD11b+ CD115+ macrophages (A) and the MHC II+ macrophage subpopulation (B) from P2, P4, P6, P8, or P12 in CD11c-EYFP mice. (C) Quantification of total cell, F4/80+ICAM2+, MHC IIlo, or MHC II+ macrophage subpopulations shown in A and B. P-values from multiple comparisons of two-way ANOVA: *, P < 0.05; **, P < 0.01; ****, P < 0.0001. Mean ± SEM. (D) Ly6C and GFP expression on MHC II+ and MHC IIlo cells from P4 in CX3CR1gfp/+ mice. Data are the representative of two independent experiments (n = 3 mice/experiment). (E) EYFP expression by MHC IIlo cells, CD226+ macrophages, and MHC II+ CD226 macrophages in CD11c-EYFP mice. (A–C and E) Data are pooled from at least four independent experiments (P0–2, n = 8 mice; P4–6, n = 8 mice; P8–10, n = 4 mice; P12–14, n = 4 mice).
Figure 3.
Figure 3.
CD226+ macrophages are replenished by circulating monocytes. (A and B) Quantification of peritoneal F4/80+ ICAM2+ or MHC II+ macrophages (A) or CD226+ or CD226 subsets of MHC II+ macrophages (B) in CCR2+/+ and CCR2−/− mice. Data are from three independent experiments (n = 4–5 mice/genotype, mean ± SEM). P-values, unpaired Student’s t test: *, P < 0.05. (C) Representative histogram and the quantification (graph just beneath the histogram) of Tomato reporter expression within F4/80+ macrophages and MHC II+ macrophage subpopulations in both peritoneum and pleura from tamoxifen-treated CX3CR1CreER × Rosa26Tomato mice. Data are pooled from three independent experiments (n = 9–10 mice per group, mean ± SEM). (D) CX3CR1 expression and its quantification on peritoneal and pleural F4/80+, CD226+, and MHC II+ CD226 macrophages as assessed in CX3CR1gfp/+ mice. Data are combined from two independent experiments (n = 3–6 mice per group, mean ± SEM). (E) Representative flow cytometric analysis of CD45.2 expression on CD226+macrophages in peritoneum and pleura from the CD45.1-expressing parabiont during parabiosis and the chimerism from CD45.1:CD45.2 CD11cEYFP parabiotic mice. Data are pooled from three independent experiments (n = 6–10, mean ± SEM). (C–E) P-values, multiple comparisons in one-way ANOVA: **, P < 0.01; ***, P < 0.001; ****, P < 0.0001. (F) Peritoneal cell analysis of congenic CD45.1 recipient mice at day 2.5 and day 4 after adoptive transfer of monocyte from CD45.2 CCR2gfp/+ mice. Pregated on CD45.2+ GFP+ events. Black dots indicate donor cells, and gray dots indicate recipient cells. Data are representative of three independent experiment, with n = 1 mouse/experiment per time point.
Figure 4.
Figure 4.
IRF4 governs the development of CD226+ macrophages. (A) Flow cytometric analysis of F4/80+ ICAM2+ and MHC II+ macrophage subpopulations in IRF4+/+ and IRF4−/− mice. (B–D) Quantification of peritoneal F4/80+ macrophages and MHC II+ macrophages (B), MHC II+ macrophage subpopulations (C), and blood monocytes (D) in IRF4+/+ and IRF4−/− mice. Data are from two independent experiments (n = 5–7, mean ± SEM). P-values, unpaired Student’s t test: **, P < 0.01. (E) Flow cytometric analysis of F4/80+ ICAM2+ macrophages and MHC II+ macrophage subpopulations in peritoneal cavities of CD11cΔIRF4 mice and controls that were Cre IRF4fl/fl littermates or age- and sex-matched Cre+ mice not bearing IRF4 floxed alleles. (F and G) Quantification of F4/80+ macrophages and MHC II+ macrophages (F) and MHC II+ macrophage CC226 or CD226+ subpopulations (G) in peritoneal cavities of CD11cΔIRF4 mice (ΔIRF4) and controls. (H and I) Quantification of F4/80+ ICAM2+ or MHC II+ macrophages (H) and MHC II+ macrophage subpopulations (I) in pleural cavities of CD11cΔIRF4 mice (ΔIRF4) and controls. (F–I) Data are representative of three independent experiments (n = 3–4 mice/experiment, mean ± SEM). P-values, unpaired Student’s t test: *, P < 0.05; **, P < 0.01.
Figure 5.
Figure 5.
Antibiotic sensitivity of CD226+ macrophages. (A and B) Flow cytometric analysis and quantification (below) of F4/80+ ICAM2+ and MHC II+ macrophages (A) or MHC II+ macrophage subpopulations (B) in the presence of antibiotic treatment (VNAM) or its absence (“C” for control group). Data are pooled from four independent experiments (n = 14–15/group, mean ± SEM). (C) Flow cytometric analysis of monocyte subpopulations and quantification (below) of Ly6Chi monocytes. Data are pooled from three independent experiments (n = 8/group, mean ± SEM). P-values, unpaired Student’s t test: **, P < 0.01; ***, P < 0.001.

References

    1. Baldridge M.T., Nice T.J., McCune B.T., Yokoyama C.C., Kambal A., Wheadon M., Diamond M.S., Ivanova Y., Artyomov M., and Virgin H.W.. 2015. Commensal microbes and interferon-λ determine persistence of enteric murine norovirus infection. Science. 347:266–269. 10.1126/science.1258025 - DOI - PMC - PubMed
    1. Boring L., Gosling J., Chensue S.W., Kunkel S.L., Farese R.V. Jr., Broxmeyer H.E., and Charo I.F.. 1997. Impaired monocyte migration and reduced type 1 (Th1) cytokine responses in C-C chemokine receptor 2 knockout mice. J. Clin. Invest. 100:2552–2561. 10.1172/JCI119798 - DOI - PMC - PubMed
    1. Cain D.W., O’Koren E.G., Kan M.J., Womble M., Sempowski G.D., Hopper K., Gunn M.D., and Kelsoe G.. 2013. Identification of a tissue-specific, C/EBPβ-dependent pathway of differentiation for murine peritoneal macrophages. J. Immunol. 191:4665–4675. 10.4049/jimmunol.1300581 - DOI - PMC - PubMed
    1. Caton M.L., Smith-Raska M.R., and Reizis B.. 2007. Notch–RBP-J signaling controls the homeostasis of CD8− dendritic cells in the spleen. J. Exp. Med. 204:1653–1664. 10.1084/jem.20062648 - DOI - PMC - PubMed
    1. Epelman S., Lavine K.J., Beaudin A.E., Sojka D.K., Carrero J.A., Calderon B., Brija T., Gautier E.L., Ivanov S., Satpathy A.T., et al. . 2014a Embryonic and adult-derived resident cardiac macrophages are maintained through distinct mechanisms at steady state and during inflammation. Immunity. 40:91–104. 10.1016/j.immuni.2013.11.019 - DOI - PMC - PubMed

Publication types

MeSH terms

Substances