Review
. 2016 Aug 8:7:1234.
doi: 10.3389/fmicb.2016.01234. eCollection 2016.

Bacterial Communities: Interactions to Scale

Affiliations
Review

Bacterial Communities: Interactions to Scale

Reed M Stubbendieck et al. Front Microbiol. .

Abstract

In the environment, bacteria live in complex multispecies communities. These communities span in scale from small, multicellular aggregates to billions or trillions of cells within the gastrointestinal tract of animals. The dynamics of bacterial communities are determined by pairwise interactions that occur between different species in the community. Though interactions occur between a few cells at a time, the outcomes of these interchanges have ramifications that ripple through many orders of magnitude, and ultimately affect the macroscopic world including the health of host organisms. In this review we cover how bacterial competition influences the structures of bacterial communities. We also emphasize methods and insights garnered from culture-dependent pairwise interaction studies, metagenomic analyses, and modeling experiments. Finally, we argue that the integration of multiple approaches will be instrumental to future understanding of the underlying dynamics of bacterial communities.

Keywords: bacterial communities; biodiversity; competition; ecology; interactions; microbiota; scaling; syntrophy.


Figures

FIGURE 1
FIGURE 1
Scaling in bacterial communities. Bacterial communities range in scale from single cells to multicellular aggregates and colonies. The action of bacterial communities extends further affecting tissues and ultimately entire hosts.
FIGURE 2
FIGURE 2
Bacteria compete for favorable microenvironments. (A) (Left) Environments, including biological tissues such as leaf surfaces, are heterogeneous with respect to favorable microenvironments. (Middle) Magnified leaf surface shown as a contoured fitness landscape. Higher peaks represent more favorable microenvironments with increased carrying capacity. For assistance in interpretation the contour surface has been overlaid onto a heat map. Red represents the most favorable microenvironments while blue represents poor microenvironments. (Right) Cells that colonize favorable microenvironments (Red) produce many progeny whereas cells occupying poor microenvironments fail to proliferate (blue). (B) Bacteria engage additional mechanisms to colonize microenvironments. (Left) Two species, represented by colored circles, which do not overlap with respect to physical location or resource usage will not compete. (Middle) When cells are in conflict for resources the species that is better adapted to exploit those resources will proliferate while the poorer exploiter struggles. (Right) A poor exploiter and use additional competitive mechanisms, such as interference, to prevent a better exploiter access to a favorable microenvironment.
FIGURE 3
FIGURE 3
Changing the dynamics of bacterial competition uncovers new competitive mechanisms. (A) (Top) Streptomyces sp. strain Mg1 (S. Mg1) (left) releases linearmycins and lyses Bacillus subtilis (right) when both organisms are grown next to each other on an agar surface. (Middle) Strains of B. subtilis that are unable to produce the specialized metabolite bacillaene (Δpks) are hypersensitive to lysis by S. Mg1. (Bottom) A mutation yfiKT83I that activates a two-component system causes B. subtilis to become linearmycin resistant. (B) S. Mg1 is plated in the horizontal direction while B. subtilis is plated in the vertical direction. (left) wild type B. subtilis is lysed by S. Mg1 as above but a linearmycin resistant (right) mutant of B. subtilis engages motility in response to the presence of S. Mg1. (C) B. subtilis plated as a spot onto a lawn of S. Mg1. The wild type S. Mg1 (left) undergoes sporulation as evident by the salmon coloration but the sporulation of a mutant unable to produce surfactin hydrolase (ΔsfhA) is inhibited. All images were taken after 72 hours of co-incubation. The scale bar is 5 mm. The panels in (A) were reproduced from Stubbendieck and Straight (2015) under the terms of the Creative Commons Attribution License.
FIGURE 4
FIGURE 4
Insights into bacterial competitive metabolism through mass spectrometry. (A) (Top) Streptomyces sp. strain Mg1 (S. Mg1) (left) releases linearmycins and lyses Bacillus subtilis (right) as in Figure 3A. (Bottom) The distribution of metabolites produced by both organisms is mapped by imaging mass spectrometry (IMS). The false-colored extracted ion image shows the distribution of diffuse chalcomycin A produced by S. Mg1 (yellow), a B. subtilis colony marker polyglutamate (blue), and an unknown colony localized metabolite produced by S. Mg1 (red, m/z 972). (B) Mass spectral molecular networking data of competitions between Streptomyces coelicolor and other actinomycetes. Each node represents a metabolite identified in a mass spectrometer and the edges between nodes indicate chemical relationship as determined by aligned tandem MS/MS spectra. Blue nodes indicate metabolites produced by S. coelicolor, red nodes are metabolites produced by competitors, yellow nodes are metabolites produced by both S. coelicolor and competitors, and gray nodes are metabolites with variable behavior. A node corresponding to desferrioxamine B is indicated and its structure is shown. Mass spectral networking identified new variants of desferrioxamines that had not been previously reported. Panel (A) was adapted from Barger et al. (2012), Copyright © Springer Science+Business Media B.V. 2012, with permission of Springer. The data in panel (B) were reproduced from Traxler et al. (2013) under the terms of the Creative Commons Attribution License.
FIGURE 5
FIGURE 5
New technologies to study bacterial communities. (A) 3D printed bacterial community consisting of a shell of Staphylococcus aureus (blue) encased by Pseudomonas aeruginosa (green) encased in a crosslinked gelatin matrix (red). The scale bar is 10 μm. (B) Photograph showing an iChip after incubation in an environmental setting. Panel (A) was provided by Jodi Connell and Marvin Whiteley. Panel (B) was reprinted by permission from Macmillan Publishers Ltd (Ledford, 2015), Copyright © 2015, Rights Managed by Nature Publishing Group.
FIGURE 6
FIGURE 6
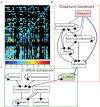
Bacteria competition in the gut microbiome. (A) Genus-level bacterial interactions in a human microbiome as predicted from community time series analysis. Each cell in the grid represents the effect of the x-axis bacterial genus on the corresponding y-axis bacterial genus. The heat map shows the strength and direction of each interaction with positive values representing cooperative behaviors and negative values representing competitive behaviors. The zero indicates amensal interactions and black cells indicate no significant interaction. (B-C) A dynamic Boolean network model of interactions in the GI tracts of mice treated with clindamycin alone (B) or mice exposed to Clostridium difficile after clindamycin treatment (C). A single edge between Barnesiella and C. difficile connects the networks and is emphasized in bold. Positive interactions are shown in black with arrowheads designating the interaction direction. Negative interactions are shown in blue with T-ends designating the interaction direction. Panel (A) was reproduced from Trosvik and de Muinck (2015) and panels (B,C) were adapted from data in Steinway et al. (2015) under the terms of the Creative Commons Attribution License.
FIGURE 7
FIGURE 7
Rock-paper-scissors (RPS) dynamics and spatial structure stabilize bacterial communities. (A,B) The log abundances of colicin producing (P), colicin sensitive (S), and colicin resistant (R) strains from cellular automata simulations are shown over simulation time. The abundances of each strain are stable if interactions occur locally (i.e., with spatial structure) (A) but under well-mixed conditions (i.e., with no spatial structure) the P and S strains go extinct, indicated by diamond symbol (B). The inset in (A) shows a snapshot of the simulation at time step 3000. Data and images were adapted by permission from Macmillan Publishers Ltd (Kerr et al., 2002), Copyright © 2002, Rights Managed by Nature Publishing Group.
FIGURE 8
FIGURE 8
Multiple approaches complement each other and provide different insights into bacterial communities. Pairwise interactions provide mechanistic detail into the competitive mechanisms employed by bacteria. Metagenomic approaches enable identification of bacteria species and their abundance in a community as represented by different colored circles. Mathematical modeling approaches predict the strength (indicated by arrow length) and direction of interactions that occur between bacterial species. The three approaches complement each other and provide the clearest picture into the underlying dynamics of a bacterial community.

References

    1. Adlerberth I. (2008). Factors influencing the establishment of the intestinal microbiota in infancy. Nestlé Nutr. Workshop Ser. Paediatr. Program. 62 13–29; discussion29–33 10.1159/000146245 - DOI - PubMed
    1. Alldredge A. L., Silver M. W. (1988). Characteristics, dynamics and significance of marine snow. Prog. Oceanogr. 20 41–82. 10.1016/0079-6611(88)90053-5 - DOI
    1. Almagro-Moreno S., Boyd E. F. (2009). Sialic acid catabolism confers a competitive advantage to pathogenic Vibrio cholerae in the mouse intestine. Infect. Immun. 77 3807–3816. 10.1128/IAI.00279-09 - DOI - PMC - PubMed
    1. Alteri C. J., Himpsl S. D., Pickens S. R., Lindner J. R., Zora J. S., Miller J. E., et al. (2013). Multicellular bacteria deploy the type VI secretion system to preemptively strike neighboring cells. PLoS Pathog. 9:e1003608 10.1371/journal.ppat.1003608 - DOI - PMC - PubMed
    1. Amann R. I., Ludwig W., Schleifer K. H. (1995). Phylogenetic identification and in situ detection of individual microbial cells without cultivation. Microbiol. Rev. 59 143–169. - PMC - PubMed

LinkOut - more resources