. 2016 Aug 8:7:144.
doi: 10.3389/fgene.2016.00144. eCollection 2016.

Detection of Significant Groups in Hierarchical Clustering by Resampling

Affiliations

Detection of Significant Groups in Hierarchical Clustering by Resampling

Paola Sebastiani et al. Front Genet. .

Abstract

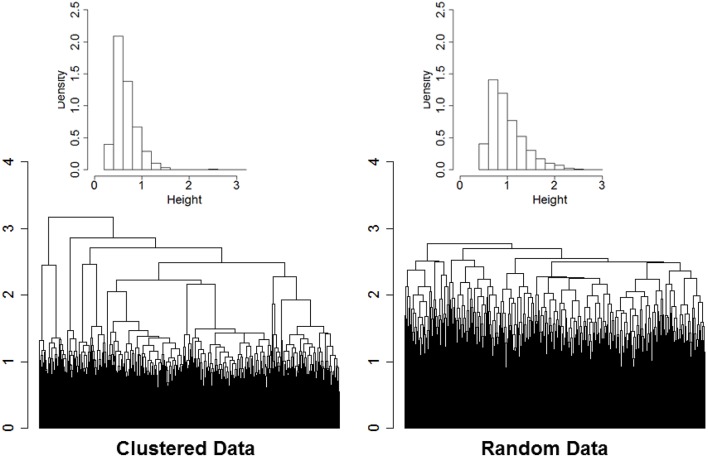
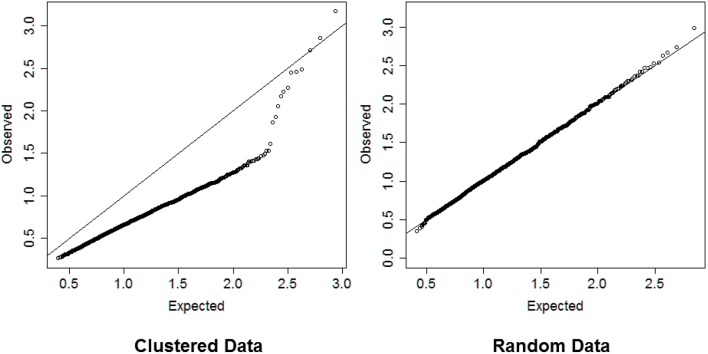
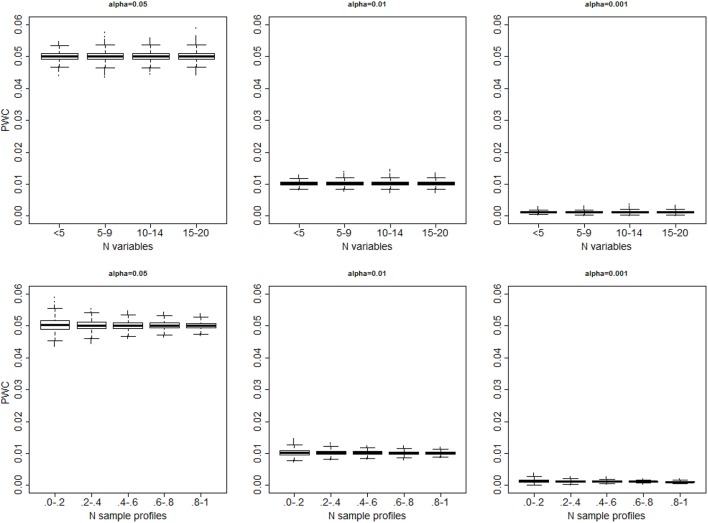
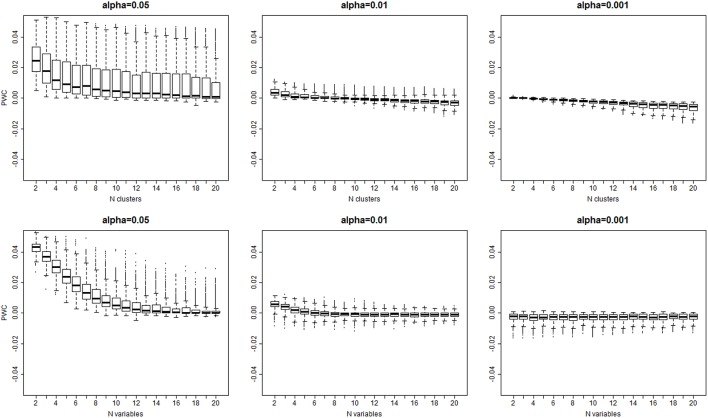
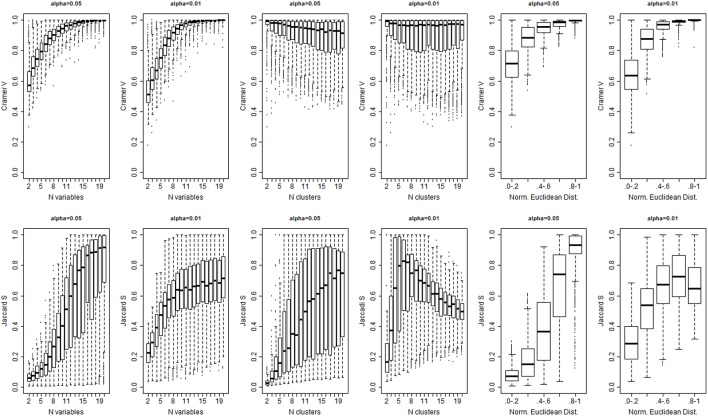
Hierarchical clustering is a simple and reproducible technique to rearrange data of multiple variables and sample units and visualize possible groups in the data. Despite the name, hierarchical clustering does not provide clusters automatically, and "tree-cutting" procedures are often used to identify subgroups in the data by cutting the dendrogram that represents the similarities among groups used in the agglomerative procedure. We introduce a resampling-based technique that can be used to identify cut-points of a dendrogram with a significance level based on a reference distribution for the heights of the branch points. The evaluation on synthetic data shows that the technique is robust in a variety of situations. An example with real biomarker data from the Long Life Family Study shows the usefulness of the method.

Keywords: dendrogram; resampling techniques; tree-cutting procedures.


Figures

Figure 1
Figure 1
Dendrogram of hierarchical clustering of 2000 profiles of 16 variables generated from 13 clusters, with cluster size ranging from 2 to 532 (left panel), and dendrogram generated from the same data after reshuffling of the rows (right panel). Data were generated from multivariate normal distributions and standardized by row. The histograms describe the distributions of the heights of the branch points.
Figure 2
Figure 2
Left panel: QQ-plot comparing expected and observed normalized distances used in hierarchical clustering of 2000 profiles of 16 variables generated from 13 clusters. Right panel: QQ-plot comparing expected and observed normalized distances used in hierarchical clustering of 2000 profiles of 16 variables generated from only one cluster. The QQ-plot is consistent with the hypothesis that when there are real clusters in the data, profiles in the same cluster should be more similar than profiles from random (unclustered) data and should produce distances that are smaller than what expected in unclusterd data, while profiles in different clusters should be more different than profiles from random data and should produce larger distances than expected by chance. Therefore, a QQ-plot with a clear S-shape as depicted in the plot on the left panel would suggest the presence of very distinct clusters in the data.
Figure 3
Figure 3
Distribution of the proportion of falsely detected clusters PWC=(ncq^-1)/(ns-1) for different significance levels (α = 0.05: left panel; α = 0.01; mid panel; α = 0.001 right panel), vs. the number of variables (top panels) and number of sample profiles generated in 10,000 simulations (bottom panels). The number of sample profiles are presented in quantiles ranges. In each set, data were generated from one cluster, and cluster detection was based on cutting the dendrogram with observed distances Do using the percentiles of the resampling-based reference distribution De.
Figure 4
Figure 4
Distribution of the error rate (PCW=(ncq^-nc)/(ns-nc)) vs. the true number of clusters (top panel), and the true number of variables bottom panel) for different significance levels α = 0.05, 0.01, 0.001. The error rate decreases with larger number of variables and larger number of clusters that are both associated with larger separation of clusters (See Supplement Figure 3).
Figure 5
Figure 5
Cramer's Index V (top panel) and Jaccard's Similarity Index (bottom panel) for different levels of significance α, numbers of variables (columns 1 and 2), number of true clusters (columns 3 and 4), and separation between true profiles (Norm. Euclidean Dist.).
Figure 6
Figure 6
QQplot of the observed heights of the branch nodes in the dendrogram of hierarchical clustering of 4704 profiles of 19 biomarkers in participants of the Long Life Family Study (y-axis) and the expected heights based on 10 resampling of the data. The departure from the diagonal line suggests that there are significant clusters in the data.
Figure 7
Figure 7
Clusters detected by cutting the dendrogram using different percentiles of the the reference distribution De in the LLFS data. The first column shows the significance level α = 1 − p where p was used to determine the percentiles of the reference distribution De. The other columns report the size of different clusters and colors track clusters that are robust with respect to different percentiles. For example, the algorithm detects 10 clusters for α = 0.001, and the largest cluster in yellow includes 2298 profiles. The bulk of this cluster is maintained when the algorithm detects 14 clusters with α = 0.002, and the 2298 profiles are split into a cluster with 2293 profiles and a smaller cluster with only 5 profiles.

References

    1. Alizadeh A. A., Eisen M. B., Davis R. E., Ma C., Lossos I. S., Rosenwald A., et al. . (2000). Distinct types of diffuse large b-cell lymphoma identified by gene expression profiling. Nature 403, 503–511. 10.1038/35000501 - DOI - PubMed
    1. Banerjee C., Ulloor J., Dillon E. L., Dahodwala Q., Franklin B., Storer T., et al. . (2011). Identification of serum biomarkers for aging and anabolic response. Immun. Ageing 8:5. 10.1186/1742-4933-8-5 - DOI - PMC - PubMed
    1. Beale E. M. L. (1969). Cluster Analysis. London: Scientific Control Systems.
    1. Caliński T., Harabasz J. (1974). A dendrite method for cluster analysis. Comm. Statist. 3, 1–27. 10.1080/03610927408827101 - DOI
    1. Charrad M., Ghazzali N., Boiteau V., Niknafs A. (2014). Nbclust: an r package for determining the relevant number of clusters in a data set. J. Stat. Softw. 61, 1–36. 10.18637/jss.v061.i06 - DOI

LinkOut - more resources