. 2016 Aug 16:2:16024.
doi: 10.1038/celldisc.2016.24. eCollection 2016.

MAVS maintains mitochondrial homeostasis via autophagy

Affiliations

MAVS maintains mitochondrial homeostasis via autophagy

Xiaofeng Sun et al. Cell Discov. .

Abstract

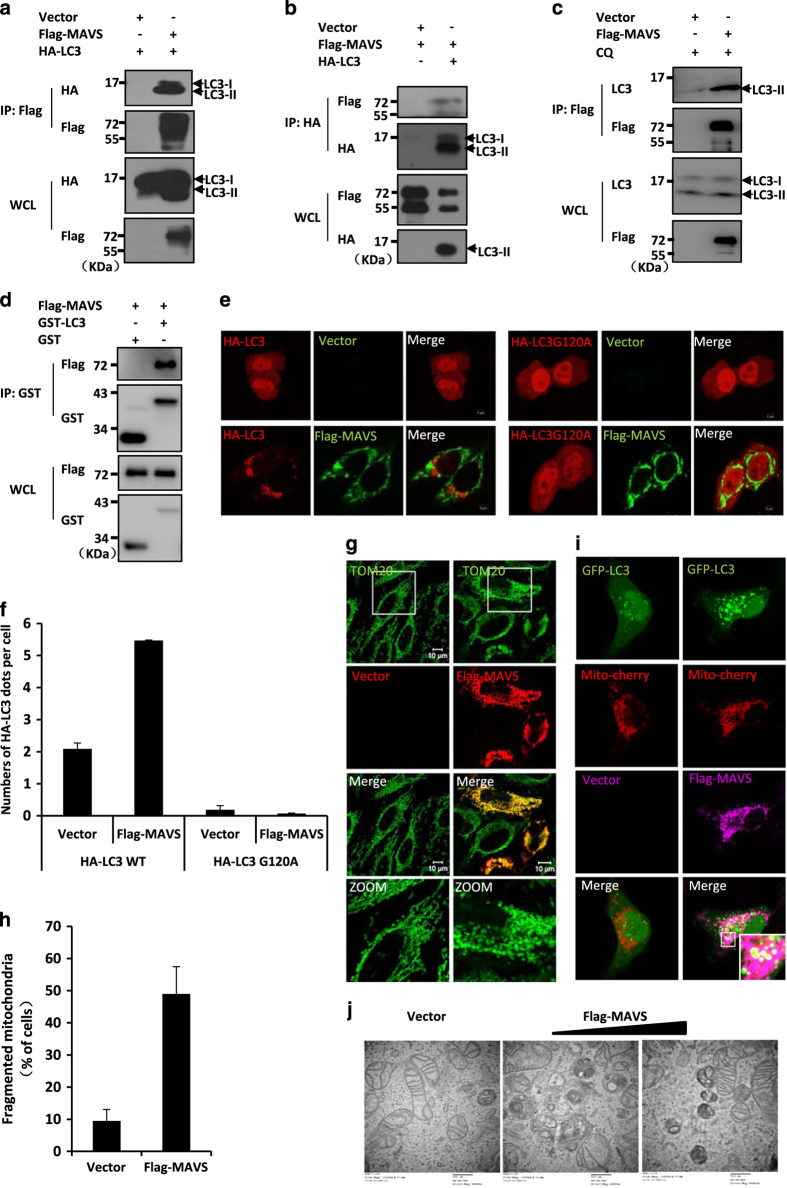
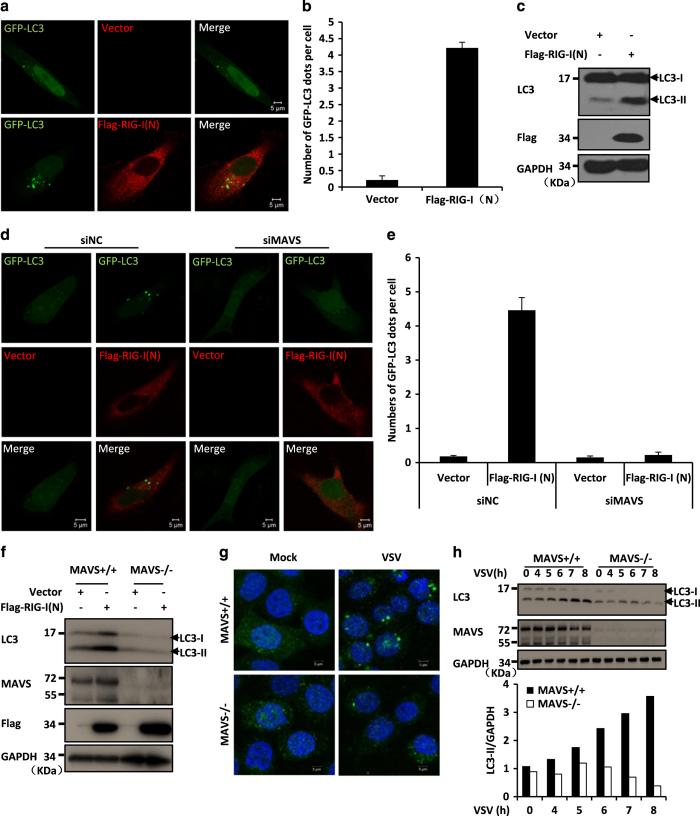
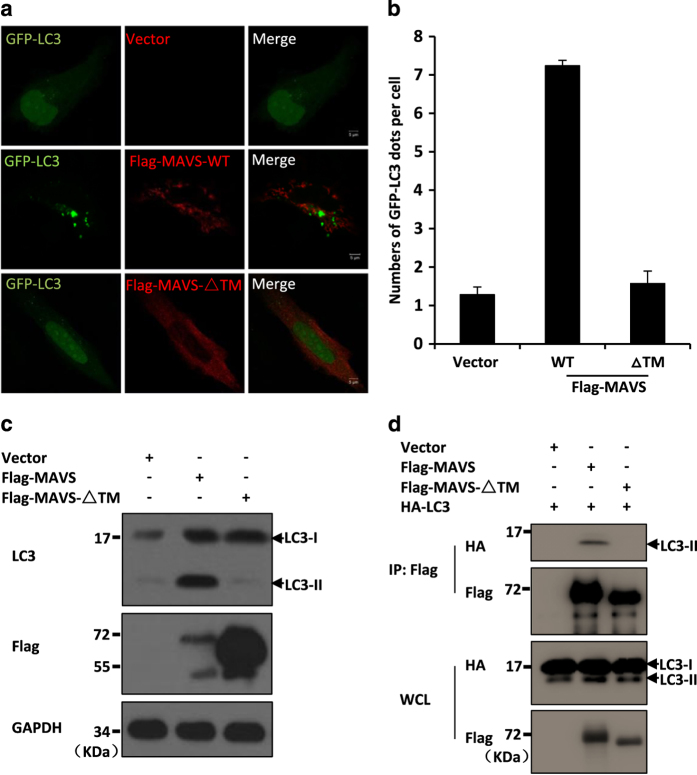
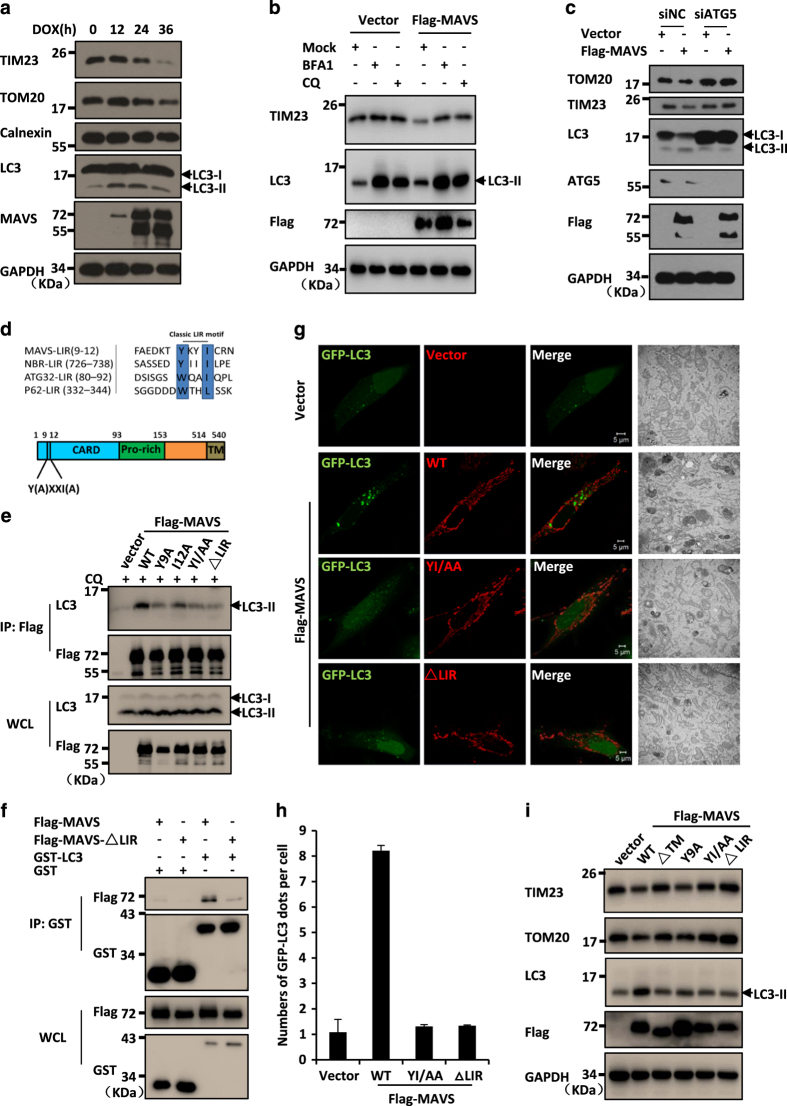
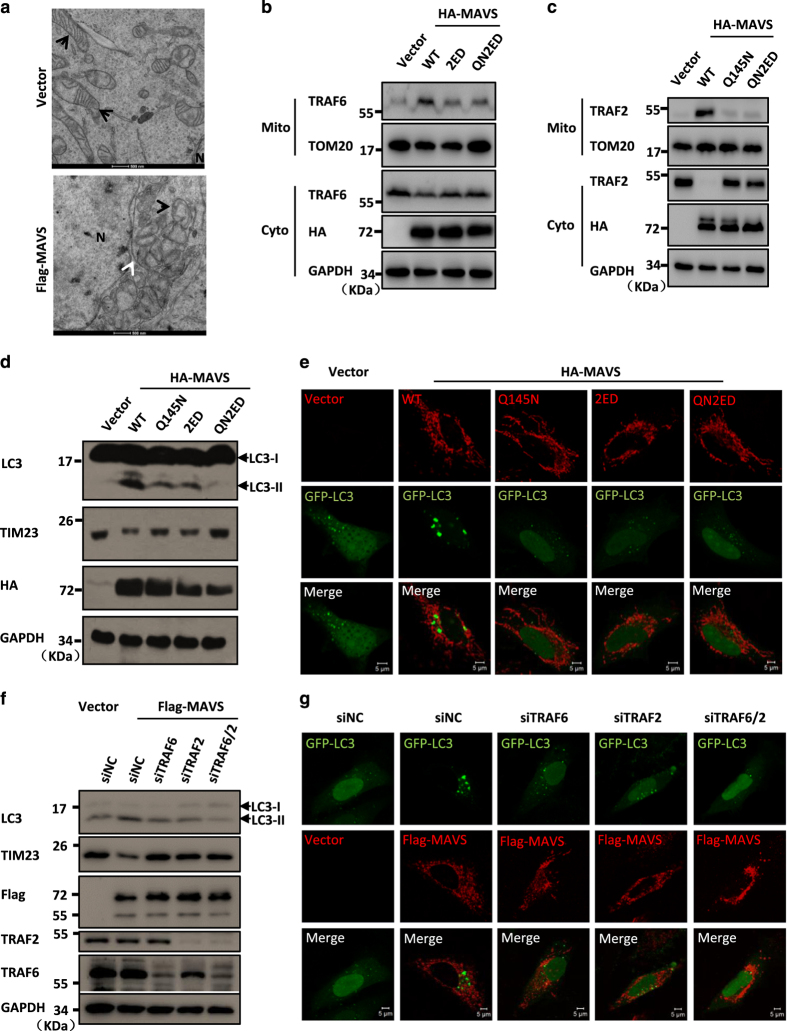
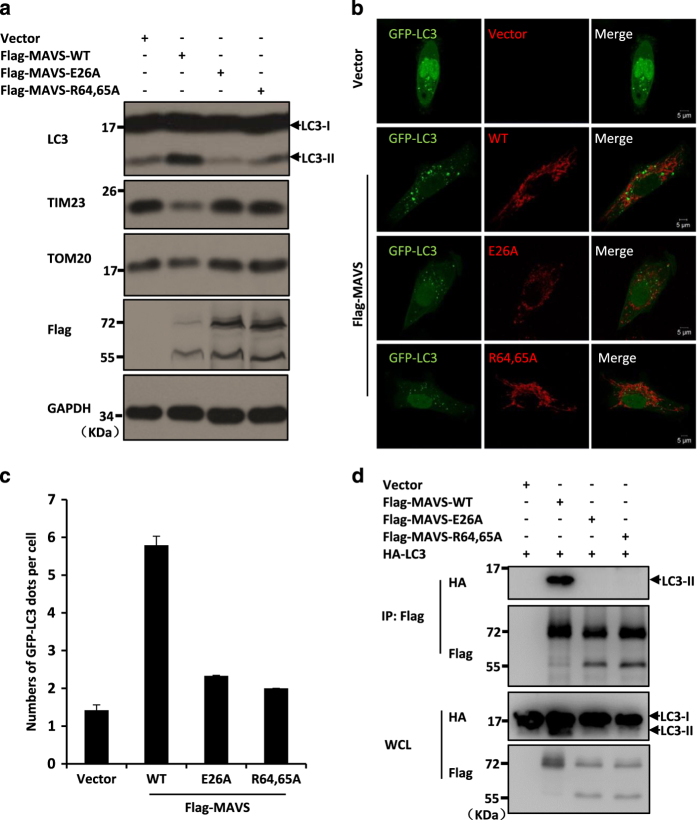
Mitochondrial antiviral signalling protein (MAVS) acts as a critical adaptor protein to transduce antiviral signalling by physically interacting with activated RIG-I and MDA5 receptors. MAVS executes its functions at the outer membrane of mitochondria to regulate downstream antiviral signalling, indicating that the mitochondria provides a functional platform for innate antiviral signalling transduction. However, little is known about whether and how MAVS-mediated antiviral signalling contributes to mitochondrial homeostasis. Here we show that the activation of MAVS is sufficient to induce autophagic signalling, which may mediate the turnover of the damaged mitochondria. Importantly, we find MAVS directly interacts with LC3 through its LC3-binding motif 'YxxI', suggesting that MAVS might act as an autophagy receptor to mediate mitochondrial turnover upon excessive activation of RLR signalling. Furthermore, we provide evidence that both MAVS self-aggregation and its interaction with TRAF2/6 proteins are important for MAVS-mediated mitochondrial turnover. Collectively, our findings suggest that MAVS acts as a potential receptor for mitochondria-associated autophagic signalling to maintain mitochondrial homeostasis.

Keywords: MAVS; autophagy; mitochondrial homeostasis.


Figures

Figure 1
Figure 1
Overexpression of MAVS induces autophagy. (a, b) HEK293 cells were transfected with expression plasmids for Flag-MAVS or an empty vector together with HA-LC3 or an empty vector. Twenty-four hours after transfection, cells were lysed and immunoprecipitated with anti-Flag beads (a) or anti-HA beads (b), followed by western blot analysis with the indicated antibodies. (c) HEK293 cells were transfected with expression plasmids for Flag-MAVS or an empty vector. Twenty-four hours after transfection, cells were treated by chloroquine (CQ) for another 4 h. The cells were lysed and immunoprecipitated with anti-Flag beads, and then followed by western blot analysis with anti-Flag or anti-LC3 antibodies. WCL (bottom), expression of transfected or endogenous proteins in whole-cell lysates. (d) HEK293 cells were transfected with Flag-MAVS. Twenty-four hours after transfection, the cells were lysed. The cell lysate and purified GST-LC3 fusion protein or GST control protein were incubated with Glutathion Sepharose 4B beads for 2 h at 4 °C, then the precipitated complex was analysed by western blot assay with the indicated antibodies. (e) HeLa cells were transfected with Flag-MAVS (green) or an empty vector and HA-LC3 (red) or HA-LC3G120A (red) as indicated. Twenty-four hours after transfection, the cells were fixed and stained with anti-Flag or anti-HA antibodies and then imaged by confocal microscopy. (f) The numbers of GFP-LC3 dots were quantified in e (mean+s.d. of ⩾50 cells). (g) HeLa cells were transfected with Flag-MAVS (red) or an empty vector. Twenty-four hours after transfection, the cells were fixed and stained with anti-Flag and anti-TOM20 (green) antibodies, and then the morphologic changes of the mitochondria were observed by confocal microscopy. (h) The percents of cells with fragmented mitochondria were quantified in g (mean+s.d. of ⩾100 cells). (i) HeLa cells were co-transfected with Mito-Cherry (red), GFP-LC3 (green) and Flag-MAVS (purple) or an empty vector. Twenty-four hours after transfection, the cells were fixed and stained with anti-Flag antibody or mounted onto slides directly and then the colocalization of the GFP-LC3 dots and the mitochondria were imaged by confocal microscopy. (j) HeLa cells were transfected with increasing amounts of MAVS expression plasmids, and an empty vector was used to balance the total DNA amount. Thirty-six hours after transfection, the cells were fixed and then analysed using electron microscopy. Scale bar, 500 nm.
Figure 2
Figure 2
MAVS is essential for the autophagy activation mediated by the RLR pathway. (a) HeLa cells were transfected with GFP-LC3 (green) and Flag-RIG-I (N) (red) or an empty vector. Twenty-four hours after transfection, the cells were fixed, stained with anti-Flag antibodies or mounted onto slides directly, and imaged by confocal microscopy. (b) The numbers of GFP-LC3 dots were quantified in a (mean+s.d. of ⩾50 cells). (c) HeLa cells were transfected with Flag-RIG-I (N) or an empty vector. Twenty-four hours after transfection, the total protein was extracted and subjected to immunoblotting analysis with the indicated antibodies. (d) HeLa cells were transfected with negative control (NC) or MAVS RNAi oligos. Twenty-four hours after transfection with the oligos, GFP-LC3 and Flag-RIG-I (N) or an empty vector were transfected into the RNAi-transfected cells. Twenty-four hours after the second transfection, the cells were fixed, stained with anti-Flag antibody or mounted onto slides directly, and imaged by confocal microscopy. (e) The numbers of GFP-LC3 dots were quantified in d (mean+s.d. of ⩾50 cells). (f) HeLa wild-type (WT) or MAVS knockout cells, which were generated by the CRISPR/Cas9 system, were transfected with Flag-RIG-I (N) or an empty vector. Twenty-four hours after transfection, the total protein was extracted and subjected to immunoblotting analysis with the indicated antibodies. (g) HeLa WT or MAVS knockout cells were left untreated or infected with VSV at a multiplicity of infection (MOI) of 1 for 8 h. Cells were fixed, stained with anti-LC3 antibody (green) and 4′,6-diamidino-2-phenylindole (blue), and then imaged by confocal microscopy. (h) HeLa WT and MAVS knockout cells were left untreated or infected with or without VSV at MOI of 1 for the indicated times. Total protein was extracted and subjected to immunoblotting analysis with the indicated antibodies. Densitometry analyses to quantify the levels of LC3-II expression are shown in the bottom panel.
Figure 3
Figure 3
MAVS induces autophagy through its TM domain. (a) HeLa cells were transfected with GFP-LC3 (green) together with an empty vector, Flag-MAVS or Flag-MAVS-ΔTM vector. Twenty-four hours after transfection, the cells were fixed, stained with anti-Flag antibodies (red), and imaged by confocal microscopy. (b) The numbers of GFP-LC3 dots were quantified in a (mean±s.d. of ⩾50 cells). (c) HeLa cells were transfected with the expression plasmids encoding a control vector, Flag-MAVS or Flag-MAVS-ΔTM. Twenty-four hours after transfection, the total protein was extracted and subjected to immunoblotting analysis with the indicated antibodies. (d) HEK293 cells were transfected with the indicated expression plasmids. Twenty-four hours after transfection, the cell lysates were prepared and immunoprecipitated with anti-Flag beads then followed by western blot analyses.
Figure 4
Figure 4
MAVS functions as a potential mitophagy receptor through interaction with LC3 via its LIR motif. (a) HeLa cell lines stably expressing MAVS induced by DOX were treated with DOX (0.25 μg ml−1) at the indicated times, then cells were lysed directly and subjected to immunoblotting analysis with the indicated antibodies. (b) HeLa cells were transfected with an empty vector or Flag-MAVS. Twenty-four hours after transfection, the cells were either left untreated or treated with bafilomycin A1 (BFA1) for 12 h or chloroquine (CQ) for 4 h. After treatment, the total protein was extracted and subjected to immunoblotting analyses with the indicated antibodies. (c) HeLa cells were transfected with negative control (NC) or ATG5 RNAi oligos. Twenty-four hours after transfection, Flag-MAVS or empty vectors were transfected into the RNAi cells. Thirty-six hours after the second transfection, the total protein was extracted and subjected to immunoblotting analysis with the indicated antibodies. (d) The sequences of LIR motif (W/YXXI/L) in MAVS were aligned manually with typical autophagy receptors. (e) HEK293 cells were transfected with expression plasmids encoding a control vector, wild-type Flag-MAVS or its LIR mutant forms. Twenty-four hours after transfection, the cells were treated with CQ for 4 h. Cell lysates were prepared and immunoprecipitated with anti-Flag beads, followed by western blot analyses. (f) HEK293 cells were transfected with Flag-MAVS or Flag-MAVSΔLIR. Twenty-four hours after transfection, the cell lysates and purified GST-LC3 fusion protein or GST control protein were incubated with Glutathion Sepharose 4B beads for 2 h at 4 °C, then the precipitated complex was analysed by western blot assay with the indicated antibodies. (g) HeLa cells were co-transfected with GFP-LC3 (green) together with an empty vector or wild-type or LIR mutant forms of MAVS (red). Twenty-four hours after transfection, the cells were fixed and imaged by confocal microscopy (left panel) or by electron microscopy (right panel). (h) The numbers of GFP-LC3 dots were quantified in g (mean±s.d. of ⩾50 cells). (i) HeLa cells were transfected with the indicated plasmids. Thirty-six hours after transfection, the total protein was extracted and subjected to immunoblotting analysis with the indicated antibodies.
Figure 5
Figure 5
Recruitment of TRAF2 and TRAF6 onto the mitochondria induce MAVS-mediated mitophagy. (a) HeLa cells were transfected with Flag-MAVS or an empty vector. Twenty-four hours after transfection, the cells were fixed and analysed by electron microscopy. The black arrows indicate the mitochondria, the white arrow shows a double membrane outside of the clustered mitochondria and N indicates nucleus. (b, c) HeLa cells were transfected with the indicated plasmids. Twenty-four hours after transfection, the crude mitochondrial fraction (P5) and the cytosolic fraction (S5) were separated, and the translocation of TRAF6 (b) or TRAF2 (c) was detected by western blot analysis. (d) HeLa cells were transfected with the indicated plasmids. Thirty-six hours after transfection, the total protein was extracted and subjected to immunoblotting analysis with the indicated antibodies. (e) HeLa cells were co-transfected with GFP-LC3 (green) together with an empty vector or wild-type or TRAF2/6-binding mutant forms of MAVS (red). Twenty-four hours after transfection, the cells were fixed, stained anti-HA antibody and imaged by confocal microscopy. (f) HeLa cells were transfected with RNAi oligos (20 nM) targeting TRAF6 or TRAF2, or with negative control (NC) oligos as indicated. Twenty-four hours after transfection, the cells were transfected with an empty vector or Flag-MAVS. Thirty-six hours after the second transfection, the total protein was extracted and subjected to immunoblotting analysis with the indicated antibodies. (g) HeLa cells were transfected with RNAi oligos (20 nM) targeting TRAF6 or TRAF2, or with NC oligos as indicated. Twenty-four hours after transfection with the oligos, GFP-LC3 and Flag-MAVS or an empty vector were transfected into the RNAi-transfected cells. Twenty-four hours after the second transfection, the cells were fixed, stained with anti-Flag antibody and then imaged by confocal microscopy.
Figure 6
Figure 6
The role of MAVS aggregation in its function in mediating mitophagy. (a) HeLa cells were transfected with the indicated plasmids. Thirty-six hours after transfection, the total protein was extracted and subjected to immunoblotting analyses with the indicated antibodies. (b) HeLa cells were co-transfected with GFP-LC3 (green) together with wild-type Flag-MAVS or its aggregation mutant forms (red). Twenty-four hours after transfection, the cells were fixed, stained by the anti-Flag antibody and imaged by confocal microscopy. (c) The numbers of GFP-LC3 dots were quantified in (b) (mean±s.d. of ⩾50 cells). (d) HEK293 cells were transfected with the indicated plasmids. Twenty-four hours after transfection, the cells were lysed and immunoprecipitated with anti-Flag beads, and then followed by western blot analysis.

Similar articles

Cited by

References

    1. Akira S, Uematsu S, Takeuchi O. Pathogen recognition and innate immunity. Cell 2006; 124: 783–801. - PubMed
    1. Yoneyama M, Kikuchi M, Natsukawa T et al. The RNA helicase RIG-I has an essential function in double-stranded RNA-induced innate antiviral responses. Nat Immunol 2004; 5: 730–737. - PubMed
    1. Andrejeva J, Childs KS, Young DF et al. The V proteins of paramyxoviruses bind the IFN-inducible RNA helicase, mda-5, and inhibit its activation of the IFN-beta promoter. Proc Natl Acad Sci USA 2004; 101: 17264–17269. - PMC - PubMed
    1. Seth RB, Sun L, Ea CK, Chen ZJ. Identification and characterization of MAVS, a mitochondrial antiviral signaling protein that activates NF-kappaB and IRF 3. Cell 2005; 122: 669–682. - PubMed
    1. Kawai T, Takahashi K, Sato S et al. IPS-1, an adaptor triggering RIG-I- and Mda5-mediated type I interferon induction. Nat Immunol 2005; 6: 981–988. - PubMed

LinkOut - more resources