

Post-translational allosteric activation of the P2X7 receptor through glycosaminoglycan chains of CD44 proteoglycans
- PMID: 27551441
- PMCID: PMC4979527
- DOI: 10.1038/cddiscovery.2015.5
Post-translational allosteric activation of the P2X7 receptor through glycosaminoglycan chains of CD44 proteoglycans
Abstract
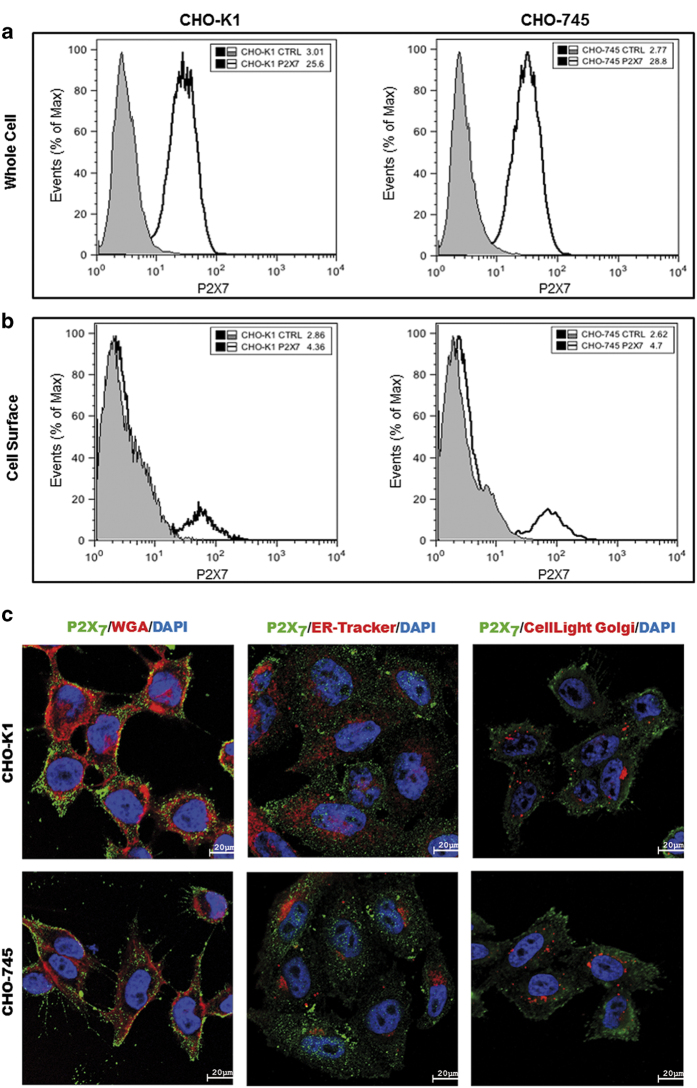
Here, we present evidence for the positive allosteric modulation of the P2X7 receptor through glycosaminoglycans (GAGs) in CHO (cell line derived from the ovary of the Chinese hamster) cells. The marked potentiation of P2X7 activity through GAGs in the presence of non-saturating agonists concentrations was evident with the endogenous expression of the receptor in CHO cells. The presence of GAGs on the surface of CHO cells greatly increased the sensitivity to adenosine 5'-triphosphate and changed the main P2X7 receptor kinetic parameters EC50, Hill coefficient and E max. GAGs decreased the allosteric inhibition of P2X7 receptor through Mg(2+). GAGs activated P2X7 receptor-mediated cytoplasmic Ca(2+) influx and pore formation. Consequently, wild-type CHO-K1 cells were 2.5-fold more sensitive to cell death induced through P2X7 agonists than mutant CHO-745 cells defective in GAGs biosynthesis. In the present study, we provide the first evidence that the P2X7 receptor interacts with CD44 on the CHO-K1 cell surface. Thus, these data demonstrated that GAGs positively modulate the P2X7 receptor, and sCD44 is a part of a regulatory positive feedback loop linking P2X7 receptor activation for the intracellular response mediated through P2X7 receptor stimulation.
Figures


Similar articles
-
Heparan sulfate proteoglycan deficiency up-regulates the intracellular production of nitric oxide in Chinese hamster ovary cell lines.J Cell Physiol. 2018 Apr;233(4):3176-3194. doi: 10.1002/jcp.26160. Epub 2017 Oct 9. J Cell Physiol. 2018. PMID: 28833096
-
Identification and characterization of an endogenous P2X7 (P2Z) receptor in CHO-K1 cells.Br J Pharmacol. 1998 Nov;125(6):1194-201. doi: 10.1038/sj.bjp.0702205. Br J Pharmacol. 1998. PMID: 9863647 Free PMC article.
-
The phenothiazine-class antipsychotic drugs prochlorperazine and trifluoperazine are potent allosteric modulators of the human P2X7 receptor.Neuropharmacology. 2013 Dec;75:365-79. doi: 10.1016/j.neuropharm.2013.07.027. Epub 2013 Aug 14. Neuropharmacology. 2013. PMID: 23954492
-
DC-SIGN and L-SIGN Are Attachment Factors That Promote Infection of Target Cells by Human Metapneumovirus in the Presence or Absence of Cellular Glycosaminoglycans.J Virol. 2016 Aug 12;90(17):7848-63. doi: 10.1128/JVI.00537-16. Print 2016 Sep 1. J Virol. 2016. PMID: 27334579 Free PMC article.
-
Modulation of the Plasma Kallikrein-Kinin System Proteins Performed by Heparan Sulfate Proteoglycans.Front Physiol. 2017 Jul 11;8:481. doi: 10.3389/fphys.2017.00481. eCollection 2017. Front Physiol. 2017. PMID: 28744223 Free PMC article. Review.
Cited by
-
H3 relaxin protects against calcium oxalate crystal-induced renal inflammatory pyroptosis.Cell Prolif. 2020 Oct;53(10):e12902. doi: 10.1111/cpr.12902. Epub 2020 Sep 18. Cell Prolif. 2020. PMID: 32945585 Free PMC article.
-
Roles of extracellular nucleotides and P2 receptors in ectodomain shedding.Cell Mol Life Sci. 2016 Nov;73(22):4159-4173. doi: 10.1007/s00018-016-2274-2. Epub 2016 May 14. Cell Mol Life Sci. 2016. PMID: 27180276 Free PMC article. Review.
-
To Inhibit or Enhance? Is There a Benefit to Positive Allosteric Modulation of P2X Receptors?Front Pharmacol. 2020 May 12;11:627. doi: 10.3389/fphar.2020.00627. eCollection 2020. Front Pharmacol. 2020. PMID: 32477120 Free PMC article. Review.
-
P2RX7 Purinoceptor as a Therapeutic Target-The Second Coming?Front Chem. 2018 Jun 28;6:248. doi: 10.3389/fchem.2018.00248. eCollection 2018. Front Chem. 2018. PMID: 30003075 Free PMC article. Review.
-
P2X7 Interactions and Signaling - Making Head or Tail of It.Front Mol Neurosci. 2019 Aug 7;12:183. doi: 10.3389/fnmol.2019.00183. eCollection 2019. Front Mol Neurosci. 2019. PMID: 31440138 Free PMC article. Review.
References
-
- Ariens EJ . Affinity and intrinsic activity in the theory of competitive inhibition. I. Problems and theory. Arch Int Pharmacodyn Ther 1954; 99: 32–49. - PubMed
-
- Kenakin T . Principles: receptor theory in pharmacology. Trends Pharmacol Sci 2004; 25: 186–192. - PubMed
-
- Kuschert GS , Coulin F , Power CA , Proudfoot AE , Hubbard RE , Hoogewerf AJ et al. Glycosaminoglycans interact selectively with chemokines and modulate receptor binding and cellular responses. Biochemistry 1999; 38: 12959–12968. - PubMed
LinkOut - more resources
Full Text Sources
Other Literature Sources
Miscellaneous
