. 2015 Sep 14:1:15030.
doi: 10.1038/cddiscovery.2015.30. eCollection 2015.

ALS-associated mutant FUS inhibits macroautophagy which is restored by overexpression of Rab1

Affiliations

ALS-associated mutant FUS inhibits macroautophagy which is restored by overexpression of Rab1

K Y Soo et al. Cell Death Discov. .

Abstract

Amyotrophic lateral sclerosis (ALS) is characterised by the formation of intracellular misfolded protein inclusions that form in motor neurons. Autophagy is the major degradation pathway for aggregate-prone proteins within lysosomes. Autophagy begins by the production of the omegasome, forming the autophagosome membrane, which then fuses with the lysosome. Mutations in fused in sarcoma (FUS) cause 5% of familial ALS cases and FUS-positive inclusions are also formed in sporadic ALS tissues. In this study, we demonstrate that the expression of ALS-associated mutant FUS impairs autophagy in neuronal cells. In mutant FUS-expressing neuronal cells, accumulation of ubiquitinated proteins and autophagy substrates p62 and NBR1 was detected, and formation of both the omegasome and autophagosome was inhibited in these cells. However, overexpression of Rab1 rescued these defects, suggesting that Rab1 is protective in ALS. The number of LC3-positive vesicles was also increased in motor neurons from the spinal cord of an ALS patient carrying a FUS (R521C) mutation compared with a control patient, providing additional evidence that autophagy is dysregulated in mutant FUS-associated ALS. This study provides further understanding of the intricate autophagy system and neurodegeneration in ALS.


Figures

Figure 1
Figure 1
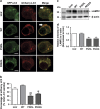
Overexpression of mFUS inhibits autophagy. (a) Representative images of Neuro2a cells co-transfected with HA-FUS (WT or mutant) and HttQ74-GFP constructs for 18 h. Cells were fixed and immunocytochemistry was performed using anti-HA antibodies, followed by confocal microscopy. Scale bar=10 μm. (b) Quantification of the percentage of transfected cells bearing HttQ74 inclusions in (a), n=3. Untr represents untransfected cells. (c) Immunoblotting of soluble cell lysates from HA-FUS (WT or mutant) expressing Neuro2a cells using anti-HA and anti-LC3 antibodies. Blots were stripped and reprobed with β-actin as a loading control. Cells treated with bafilomycin A1 (Baf) were used as a control. (d) Quantification of the relative intensities of LC3-II from immunoblotting in (c), normalised to untransfected cells, n=5. (e) Representative images of Neuro2a cells co-transfected with HA-FUS (WT or mutant) and Dsred-LC3 for 18 h. White arrows indicate LC3-positive vesicles. Scale bar=10 μm. (f) Quantification of cells in (e) containing >5 LC3-positive vesicles, n=3. (g) Neuro2a cells were transfected with HA-FUS (WT or mutant) for 18 h. Transfected cells were then treated with bafilomycin (100 nM)) for a further 6 h. Cell lysates were collected and subjected to immunoblotting using anti-LC3 antibodies. Blots were stripped and reprobed for β-actin as loading control. (h) Quantification of the relative intensities of LC3-II from immunoblotting in (g) from cells treated with Bafilomycin, normalised to untransfected cells, n=4. (i) Transmission electron microscopy images of Bafilomycin-treated Neuro2a cells expressing HA-FUS (WT or mutant). Arrow heads indicate autophagic vacuoles. Scale bars=2 μm. (j) Quantification of the number of autophagic vacuoles per cell, from a total of 20 cells from each sample, n=2. Mean±S.E.M. One-way ANOVA with Tukey post hoc test. *P<0.05, **P<0.0001, ***P<0.00001 versus Untr, # P<0.05, ## P<0.0001 versus WT.
Figure 2
Figure 2
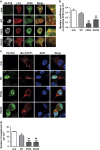
Overexpression of mFUS inhibits the clearance of ubiquitinylated proteins. (a) Effect of mFUS overexpression on the levels of p62. EGFP-p62 and EGFP (1.5 : 1) were co-transfected with HA-FUS (WT or mutant) in Neuro2a cells for 18 h. EGFP was used as a control for transfection efficiency of EGFP-p62. Cell lysates were collected and subjected to immunoblotting using anti-GFP antibodies. (b) Quantification of the relative intensities of EGFP-p62 from the immunoblots in (a), normalised to untransfected cells, n=5. (c) Neuro2a cells were co-transfected with HA-FUS (WT or mutant) and Dsred-LC3 for 18 h. Cells were then fixed and immunocytochemistry using anti-NBR1 antibodies was performed. Merge images and insets demonstrating co-localisation of LC3 and NBR1 are shown. Scale bar=10 μm. (d) Quantification of the percentage of vesicles with co-localisation of LC3 and NBR1, n=3. Approximately 10 to 20 cells were scored in each experiments. Mean±S.E.M. One-way ANOVA with Tukey post hoc test. *P<0.05, ***P<0.00001 versus Untr, ### P<0.00001 versus WT.
Figure 3
Figure 3
Formation of autolysosomes is inhibited in cells expressing mFUS. (a) Neuro2a cells were co-transfected with HA-FUS (WT or mutant) and mCherry-GFP-LC3 for 18 h before being examined using confocal microscopy. White arrows indicate mCherry-LC3 (indicating lysosomes). Scale bar=10 μm. (b) Quantification of the percentage of vesicles with mCherry-LC3 from at least 10 cells of each sample, n=3. (c) SHSY5Y cells were co-transfected with HA-FUS (WT or mutant) and pcDNA-LAMP2C vectors for 18 h. Cell lysates were collected and subjected to immunoblotting using anti-LAMP2 antibodies. Blots were stripped and re-probed with β-actin as a loading control. (d) Quantification of the relative intensities of LAMP2 in (c), normalised to untransfected cells, n=2. Mean±S.E.M. One-way ANOVA with Tukey post hoc test. *P<0.05, **P<0.0001 versus Untr, ## P<0.0001, ### P<0.00001 versus WT.
Figure 4
Figure 4
mFUS inhibits the recruitment of ATG9 to autophagosomes and the formation of omegasomes. (a) Neuro2a cells were co-transfected with HA-FUS (WT or mutant) and Dsred-LC3 for 18 h. Cells were fixed and immunocytochemistry using anti-ATG9 antibodies was performed. Merge images and inset demonstrating co-localisation between Dsred-LC3 and ATG9 is shown. Scale bar=5 μm. (b) Quantification using Mander’s coefficient of the degree of co-localisation between ATG9 and LC3. A total of 20 cells were analysed from each sample, n=2. Mean±S.E.M. One-way ANOVA with Tukey post hoc test. ***P<0.00001 versus Untr, # P<0.005, ### P<0.00001 versus WT. (c) Neuro2a cells were co-transfected with HA-FUS (WT or mutant) and myc-DFCP1 for 18 h. Cells were fixed and immunocytochemistry using anti-HA and anti-myc antibodies was performed. Cells were then counterstained with DAPI to identify the nucleus. White arrow heads indicate omegasome formation. Scale bar=10 μm. (d) Quantification of the number of omegasomes formed per cell in (c). A total of 20 cells were analysed in each sample, n=3. Mean±S.E.M. One-way ANOVA with Tukey post hoc test. *P<0.05, ***P<0.00001 versus Untr, ## P<0.0001 versus WT.
Figure 5
Figure 5
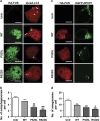
Less autophagosomes and omegasomes are formed in primary cortical neurons expressing mFUS. (a) Primary cortical neurons were co-transfected with HA-FUS (WT or mutant) and Dsred-LC3 for 18 h. Immunocytochemistry using anti-HA antibodies was then performed. White arrows indicate autophagosome formation. Scale bar=10 μm. (b) Quantification of the number of autophagosomes formed per primary neuron in (a), n=3. (c) Primary cortical neurons were co-transfected with HA-FUS (WT or mutant) and EGFP-DFCP1 for 18 h. Immunocytochemistry using anti-HA antibodies was then performed. White arrow heads indicate omegasome formation. Scale bar=10 μm. (d) Quantification of the number of omegasomes formed per primary neuron in (c), n=3. Mean±S.E.M. One-way ANOVA with Tukey post hoc test. *P<0.05, ***P<0.00001 versus Untr, # P<0.05, ### P<0.00001 versus WT.
Figure 6
Figure 6
Rab1 overexpression restores autophagosome, omegasome and autolysosome formation in cells expressing mFUS. (a) Neuro2a cells were co-transfected with HA-FUS (WT or mutant), Dsred-LC3 and CFP-Rab1 vectors (or CFP empty vector) for 18 h. Scale bar=10 μm. (b) Neuro2a cells were co-transfected with HA-FUS (WT or mutant), myc-DFCP1 and CFP-Rab1 (or CFP empty vector) vectors for 18 h. Scale bar=10 μm. (c) Quantification of the percentage of cells in (a) with >5 LC3 vesicles per cell, n=3. (d) Quantification of the number of omegasomes per cell in (b), n=3. (e) Neuro2a cells were co-transfected with HA-FUS (WT or mutant), mCherry-GFP-LC3 and CFP-Rab1 vectors (or CFP empty vector) for 18 h. Scale bar=10 μm. (f) Quantification of the percentage of vesicles with mCherry-LC3 signal in at least 10 cells from each sample, n=3. Mean±S.E.M. Two-paired Student t-test. *P<0.05, **P<0.0001, ***P<0.00001.
Figure 7
Figure 7
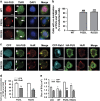
Rab1 overexpression inhibits the recruitment of mFUS to SGs and reduces the size of SGs formed. (a) Neuro2a cells were transfected with HA-FUS (WT or mutant) for 18 h. Cells were fixed and immunostained with anti-TIAR antibodies, and counterstained with DAPI to identify the nucleus. Merge images between HA, TIAR and DAPI are shown. White arrows indicate SGs. Scale bar=10 μm. (b) Quantification of the % of cells displaying co-localisation between FUS and TIAR, indicating recruitment of FUS to SGs, n=3. (c) Neuro2a cells were co-transfected with HA-FUS (WT or mutant) and CFP-Rab1 vectors (or CFP empty vector) for 18 h. Cells were fixed and immunostained with anti-HuR antibodies and counterstained with DAPI to identify the nucleus. Merge images between HA, HuR and DAPI are shown. White arrows indicate SGs. Scale bar=10 μm. (d) Quantification of cells displaying co-localisation between FUS and HuR, indicating recruitment of FUS to SGs, n=3. (e) Quantification of the size of each SG formed (μm2). The size of SG was scored from at least 40 SGs in each sample, n=3. Mean±S.E.M. Two-paired Student t-test. *P<0.05, **P<0.0001, ***P<0.00001.
Figure 8
Figure 8
LC3-positive vesicles were increased in motor neurons from an ALS patient carrying R521C FUS mutation. (a) Immunohistochemistry of human post-mortem spinal cord sections (5 μm) from a FUS mutation R521C ALS patient and a control case using an anti-LC3 antibody. Scale bar=40 μm. (b) The number of LC3-positive vesicles was quantified from a total of 40 motor neurons per patient, n=40. Mean±S.E.M. One-way ANOVA with Tukey post hoc test. *P<0.05.

Similar articles

Cited by

References

    1. Kwiatkowski TJ , Bosco DA , Leclerc AL , Tamrazian E , Vanderburg CR , Russ C et al. Mutations in the FUS/TLS gene on chromosome 16 cause familial amyotrophic lateral sclerosis. Science 2009; 323: 1205–1208. - PubMed
    1. Vance C , Rogeli B , Hortobagyi T , De Vos KJ , Nishimura AL , Sreedharan J et al. Mutations in FUS, an RNA processing protein, cause familial amyotrophic lateral sclerosis type 6. Science 2009; 323: 1208–1211. - PMC - PubMed
    1. Blair IP , Williams KL , Warraich ST , Durnall JC , Thoeng AD , Manavis J et al. FUS mutations in amyotrophic lateral sclerosis: clinical, pathological, neurophysiological and genetic analysis. J Neurol Neurosurg Psychiatry 2010; 81: 639–645. - PubMed
    1. Hewitt C , Kirby J , Highley JR , Hartley JA , Hibberd R , Hollinger HC et al. Novel FUS/TLS mutations and pathology in familial and sporadic amyotrophic lateral sclerosis. Arch Neurol 2010; 67: 455–461. - PubMed
    1. Mathew R , Karp CM , Beaudoin B , Vuong N , Chen G , Chen HY et al. Autophagy suppresses tumorigenesis through elimination of p62. Cell 2009; 137: 1062–1075. - PMC - PubMed

LinkOut - more resources