

PPARγ regulated CIDEA affects pro-apoptotic responses in glioblastoma
- PMID: 27551468
- PMCID: PMC4979534
- DOI: 10.1038/cddiscovery.2015.38
PPARγ regulated CIDEA affects pro-apoptotic responses in glioblastoma
Abstract
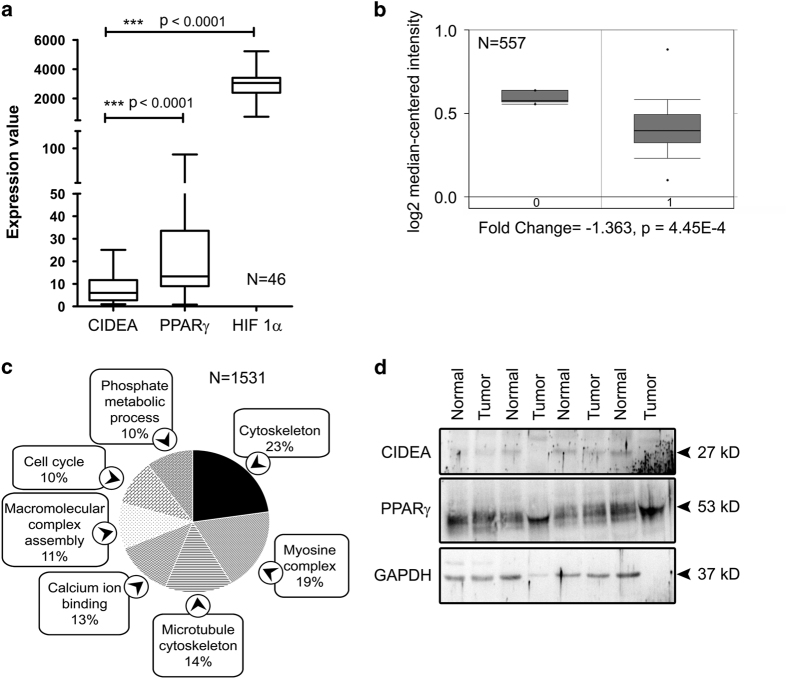
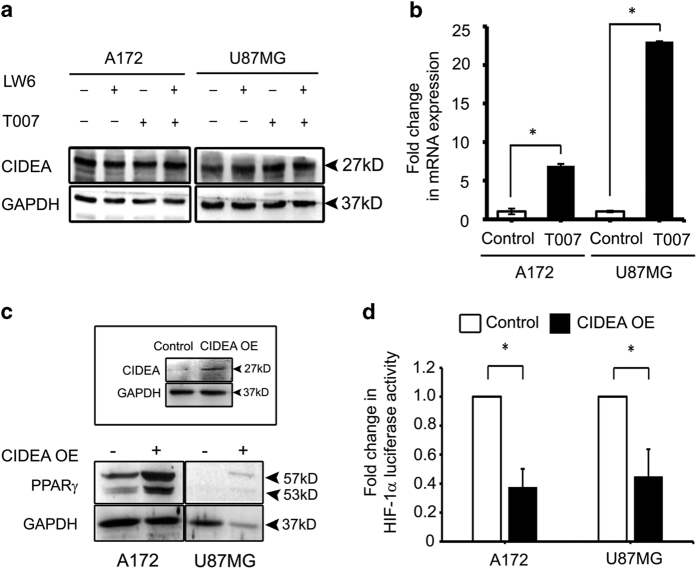
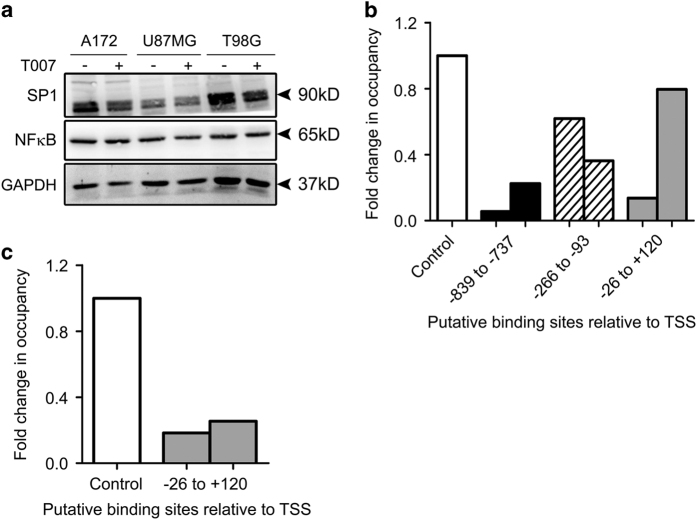
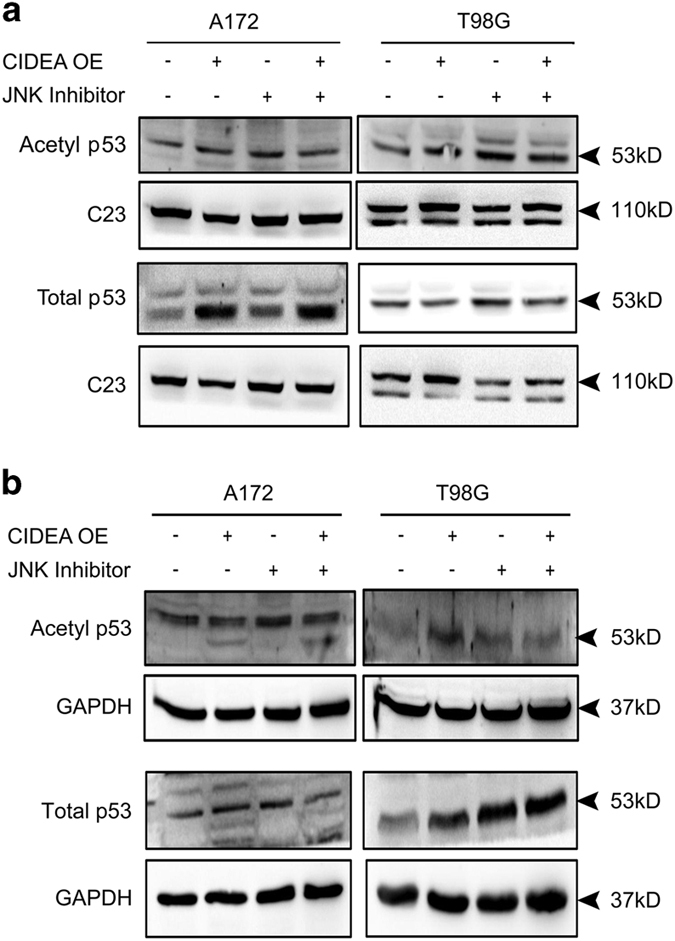
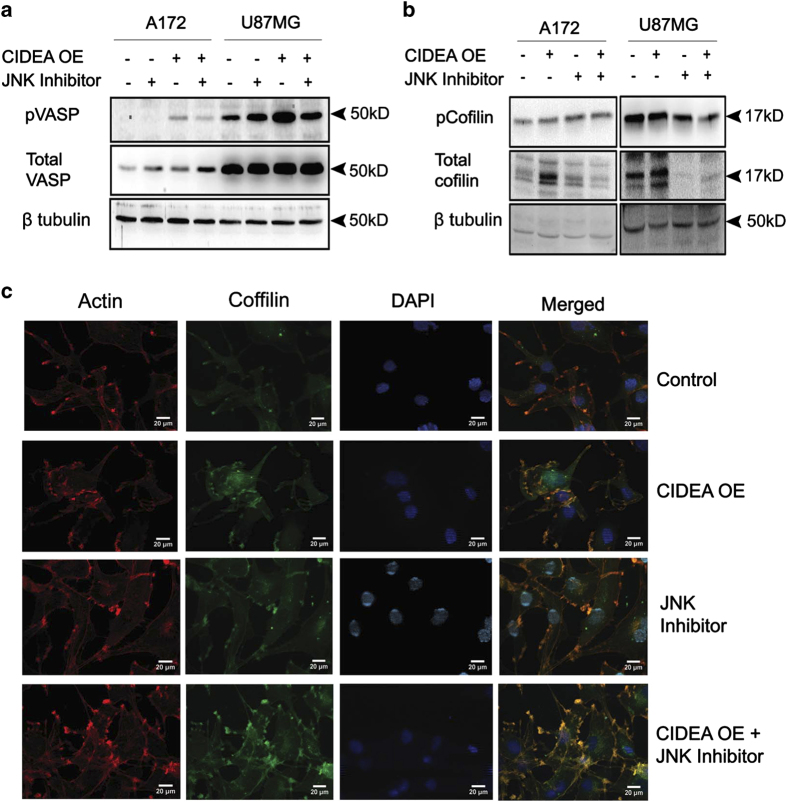
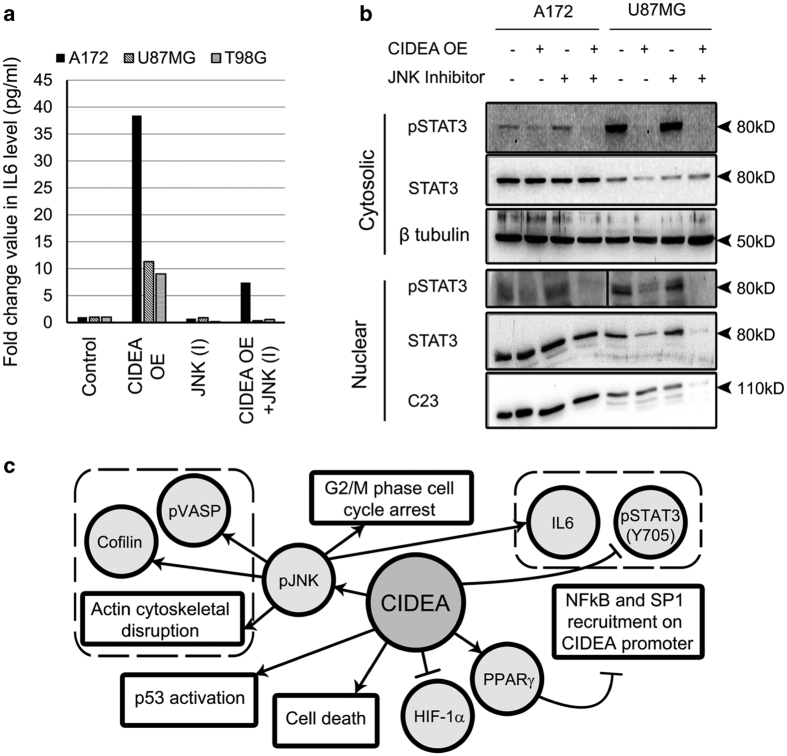
Refractoriness of glioblastoma multiforme (GBM) to current treatment paradigms has necessitated identification of new targets to better the existing therapeutic strategies. One such target is peroxisome proliferator-activated receptor gamma (PPARγ) - a transcription factor involved in regulation of lipid metabolism and inflammation. Expression of PPARγ, a known regulator of cell death-inducing DFFA-like effector (CIDEA), is modulated by hypoxia inducible factor (HIF-1α). While the involvement of CIDEA in lipid metabolism is known, its role in malignancies remains largely unknown. An elevated PPARγ and low CIDEA level was observed in GBM tumors as compared with surrounding non-neoplastic tissue. As reciprocal relation exists between PPAR and HIF-1α: and as HIF-1α is a key component in glioma progression, their role in regulating CIDEA expression in glioblastoma was investigated. Although HIF-1α inhibition had no effect on CIDEA expression, pharmacological inhibition of PPARγ elevated CIDEA levels. PPARγ mediated upregulation of CIDEA was accompanied by decreased recruitment of NFκB and SP1 to their predicted binding sites on CIDEA promoter. Ectopic expression of CIDEA triggered apoptosis, activated JNK, decreased HIF-1α activation and increased PPARγ levels in glioma cells. While CIDEA overexpression induced actin cytoskeletal disruption, cell cycle arrest, release of pro-inflammatory cytokine IL-6 in a JNK-dependent manner; CIDEA mediated apoptotic cell death, decreased STAT3 phosphorylation and increased p53 acetylation was JNK independent. This study highlights for the first time the existence of (i) PPARγ-CIDEA regulatory loop in glioma and (ii) novel function of CIDEA as regulator of glioma cell survival.
Figures

Similar articles
-
IGF-1 induced HIF-1α-TLR9 cross talk regulates inflammatory responses in glioma.Cell Signal. 2011 Nov;23(11):1869-75. doi: 10.1016/j.cellsig.2011.06.024. Epub 2011 Jul 3. Cell Signal. 2011. PMID: 21756999
-
Peroxisome proliferator-activated receptor γ inhibits pulmonary hypertension targeting store-operated calcium entry.J Mol Med (Berl). 2015 Mar;93(3):327-42. doi: 10.1007/s00109-014-1216-4. Epub 2014 Nov 14. J Mol Med (Berl). 2015. PMID: 25391250 Free PMC article.
-
Time-dependent PPARγ Modulation of HIF-1α Signaling in Hypoxic Pulmonary Artery Smooth Muscle Cells.Am J Med Sci. 2016 Jul;352(1):71-9. doi: 10.1016/j.amjms.2016.03.019. Epub 2016 Apr 4. Am J Med Sci. 2016. PMID: 27432037 Free PMC article.
-
Advances in the targeting of HIF-1α and future therapeutic strategies for glioblastoma multiforme (Review).Oncol Rep. 2017 Feb;37(2):657-670. doi: 10.3892/or.2016.5309. Epub 2016 Dec 9. Oncol Rep. 2017. PMID: 27959421 Review.
-
Crosstalk Between Peroxisome Proliferator-Activated Receptor Gamma and the Canonical WNT/β-Catenin Pathway in Chronic Inflammation and Oxidative Stress During Carcinogenesis.Front Immunol. 2018 Apr 13;9:745. doi: 10.3389/fimmu.2018.00745. eCollection 2018. Front Immunol. 2018. PMID: 29706964 Free PMC article. Review.
Cited by
-
Berberine Attenuates Nonalcoholic Hepatic Steatosis by Regulating Lipid Droplet-Associated Proteins: In Vivo, In Vitro and Molecular Evidence.J Cell Mol Med. 2025 Apr;29(7):e70524. doi: 10.1111/jcmm.70524. J Cell Mol Med. 2025. PMID: 40194991 Free PMC article.
-
Atorvastatin Inhibits the HIF1α-PPAR Axis, Which Is Essential for Maintaining the Function of Human Induced Pluripotent Stem Cells.Mol Ther. 2018 Jul 5;26(7):1715-1734. doi: 10.1016/j.ymthe.2018.06.005. Epub 2018 Jun 19. Mol Ther. 2018. PMID: 29929789 Free PMC article.
-
Potential Therapeutic Effects of PPAR Ligands in Glioblastoma.Cells. 2022 Feb 10;11(4):621. doi: 10.3390/cells11040621. Cells. 2022. PMID: 35203272 Free PMC article. Review.
-
HIF-1α signaling: Essential roles in tumorigenesis and implications in targeted therapies.Genes Dis. 2023 Mar 30;11(1):234-251. doi: 10.1016/j.gendis.2023.02.039. eCollection 2024 Jan. Genes Dis. 2023. PMID: 37588219 Free PMC article. Review.
-
Adding fuel to the fire: The lipid droplet and its associated proteins in cancer progression.Int J Biol Sci. 2022 Oct 17;18(16):6020-6034. doi: 10.7150/ijbs.74902. eCollection 2022. Int J Biol Sci. 2022. PMID: 36439875 Free PMC article. Review.
References
-
- Abreu-Vieira G , Fischer AW , Mattsson C , de Jong JM , Shabalina IG , Ryden M et al. Cidea improves the metabolic profile through expansion of adipose tissue. Nat Commun 2015; 6: 7433. - PubMed
-
- Viswakarma N , Yu S , Naik S , Kashireddy P , Matsumoto K , Sarkar J et al. Transcriptional regulation of Cidea, mitochondrial cell death-inducing DNA fragmentation factor alpha-like effector A, in mouse liver by peroxisome proliferator-activated receptor alpha and gamma. J Biol Chem 2007; 282: 18613–18624. - PubMed
-
- Zagzag D , Zhong H , Scalzitti JM , Laughner E , Simons JW , Semenza GL . Expression of hypoxia-inducible factor 1alpha in brain tumors: association with angiogenesis, invasion, and progression. Cancer 2000; 88: 2606–2618. - PubMed
LinkOut - more resources
Full Text Sources
Other Literature Sources
Research Materials
Miscellaneous
