. 2000 Dec 1;105(6):875-94.
doi: 10.6028/jres.105.068. Print 2000 Nov-Dec.

Accelerating Scientific Discovery Through Computation and Visualization

Affiliations

Accelerating Scientific Discovery Through Computation and Visualization

J S Sims et al. J Res Natl Inst Stand Technol. .

Abstract

The rate of scientific discovery can be accelerated through computation and visualization. This acceleration results from the synergy of expertise, computing tools, and hardware for enabling high-performance computation, information science, and visualization that is provided by a team of computation and visualization scientists collaborating in a peer-to-peer effort with the research scientists. In the context of this discussion, high performance refers to capabilities beyond the current state of the art in desktop computing. To be effective in this arena, a team comprising a critical mass of talent, parallel computing techniques, visualization algorithms, advanced visualization hardware, and a recurring investment is required to stay beyond the desktop capabilities. This article describes, through examples, how the Scientific Applications and Visualization Group (SAVG) at NIST has utilized high performance parallel computing and visualization to accelerate condensate modeling, (2) fluid flow in porous materials and in other complex geometries, (3) flows in suspensions, (4) x-ray absorption, (5) dielectric breakdown modeling, and (6) dendritic growth in alloys.

Keywords: IMPI; MPI; discovery science; distributed processing; immersive environments; interoperable MPI; message passing interface; parallel processing; scientific visualization.


Figures

Fig. 1
Fig. 1
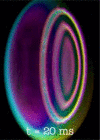
Array of vortices in a Bose-Einstein condensate under rotation.
Fig. 2
Fig. 2
Soliton produced by phase imprinting of a Bose-Einstein condensate.
Fig. 3
Fig. 3
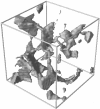
Phase separating binary mixture under shear simulated using a lattice Boltzmann method.
Fig. 4
Fig. 4
Normalized flow through spheres, as a function of the solid fraction C, centered on a simple cubic lattice. The permeability k is normalized by the square of the distance d between sphere centers. The solid fraction C is (1—porosity).
Fig. 5
Fig. 5
A 643 portion of the 7.5 % porosity Fontainebleau sandstone media. The solid matrix is made transparent to reveal the pore space (grey shaded region).
Fig. 6
Fig. 6
Measured and modeled permeabilities (k) of Fontainebleau sandstone media as a function of porosity. The solid rectangles show the modeled results.
Fig. 7
Fig. 7
Motion of a single ellipsoidal inclusion subject to shear. The single ellipsoid rotation is a well known phenomenon seen in experiments called Jefferies orbits.
Fig. 8
Fig. 8
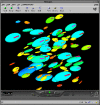
Motion of twenty eight ellipsoidal inclusions, of size varying up to a factor of two, subject to shear. Note that the Jefferies orbits are suppressed due to hydrodynamic interactions between ellipsoids.
Fig. 9
Fig. 9
A screen shot of a Web based animation using VRML to allow interactive viewing of the time series animation.
Fig. 10
Fig. 10
Runtime of a typical FeffMPI XANES calculation with cluster size. The calculation has been run on four different clusters. The execution time on a single processor has been normalized to 1.0, showing that the scaling on all clusters is very similar once the variation in processor speed and compiler quality is eliminated. The scaling indicates that about 3 % of the runtime is still from the sequentially executing parts of the code, implying that a very large cluster should run FeffMPI about 30 times faster than an equivalent single processor.
Fig. 11
Fig. 11
Measured XANES data of 4 Barium-strontium titanate (BST) films deposited by MOCVD. The variation in size and energy position of the pre-edge peak near −2 eV to +2 eV is a signature of the structural variation in these films.
Fig. 12
Fig. 12
XANES calculation from the octahdral and tetrahedral Ti-O structures shown in Figs. 13 and 14. The nearly perfect inversion symmetry of the Ti-O octahedra leads to only a small low-energy resonance in the XANES. The non-inversion symmetric tetrahedral Ti-O environment gives a much larger low-energy resonance. The qualitative similarity of these simulations with the XANES measurements shown in Fig. 11 indicates that the BST films make a transition from a non-ferroelectric phase with tetrahedral Ti-O oxygen coordination to the octahedral Ti-O structure that is characteristic of Ba-TiO3.
Fig. 13
Fig. 13
Rendering of the ideal rhombohedral structure of BaTiO3. The structure is a repetition of nearly perfect Ti-O octahedra that are separated by a nearly cubic cage of Ba atoms. The nearly perfect inversion symmetry of the Ti-O octahedra leads to only a small low-energy resonance in the XANES. Except for a mixture of both Ba and Sr atoms on the same site, this is the expected structure for BST films deposited with high substrate temperatures.
Fig. 14
Fig. 14
Rendering of the structure of Ba2TiO4. The structure is a repetition of nearly perfect Ti-O tetrahedra that are rotated with respect to each other and are separated by zig-zag chains of Ba atoms. The lack of inversion symmetry in the Ti-O tetrahedra leads to a very large low-energy resonance in the XANES.
Fig. 15
Fig. 15
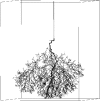
Simulation of a dense streamer growth associated with a low cutoff-voltage parameter.
Fig. 16
Fig. 16
The conical top envelope of the streamer is narrowed by increasing the cutoff-voltage parameter. The narrowing has a counterpart in experimental behavior under increased pressure.
Fig. 17
Fig. 17
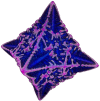
A 3D dendrite from a simulation over a grid of 3003 points. The color bar shows the coding of the relative concentration of the metals in the dendrite. The color coding ranges from concentrations of 20 % to 60 %.
Fig. 18
Fig. 18
Three 2D slices through the 3D dendrite shown in Fig. 17. The scale is the same in these three images but in order to save space the area surrounding the dendrite has been clipped. The color coding used in these images is identical to the color coding used in Fig. 17. The blue background corresponds to the initial concentration of approximately 40 %. Image A is a slice through the base of the dendrite, image B is a slice taken halfway down toward the tip of dendrite, and image C is a slice taken near the tip of the dendrite.
Fig. 19
Fig. 19
A 3D dendrite visualized using glyphs and semi-transparent colors. This image was generated from the same data as in Fig. 17. In this image the output from the simulator has been mirrored along all three axes giving a symmetric six-pointed star structure. The image in Fig. 17, due to memory limitations in computing the isosurface, was mirrored only along the x and y axes.

References

    1. Griffin TJ. NIST Scientific Applications and Visualization Group (online) Available from: < http://math.nist.gov/mcsd/savg>, Accessed 20 Nov. 2000.
    1. van Dam Andries, Forsberg Andrew, Laidlaw David, LaViola Joseph, Simpson Rosemary. Immersive VR for Scientific Visualization: A progress report. IEEE Comput Graph Appl. 2000:26–52.
    1. Message Passing Interface Forum MPI: A message-passing interface standard. Int J Supercomput Appl. 1994;8(3/4):159–416.
    1. Message Passing Interface Forum MPI-2: A message-passing interface standard. Int J Supercomput Appl High Perform Comput. 1998;12(1–2):1–299.
    1. Message Passing Interface Forum, MPI -2 (online) Available from: < http://www.mpi-forum.org/>, Accessed 20 Dec. 2000.

LinkOut - more resources