

Rich and Poor Cities in Europe. An Urban Scaling Approach to Mapping the European Economic Transition
- PMID: 27551719
- PMCID: PMC4994959
- DOI: 10.1371/journal.pone.0159465
Rich and Poor Cities in Europe. An Urban Scaling Approach to Mapping the European Economic Transition
Abstract
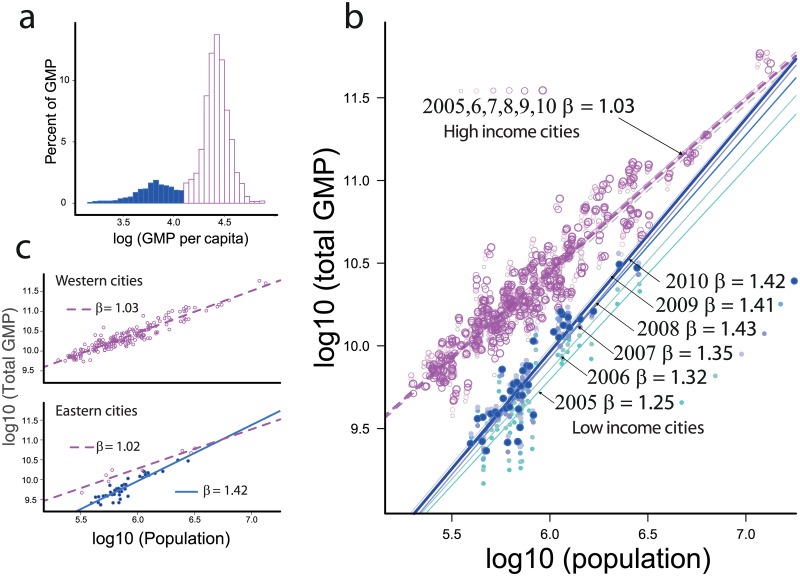
Recent advances in the urban science make broad use of the notion of scaling. We focus here on the important scaling relationship between the gross metropolitan product (GMP) of a city and its population (pop). It has been demonstrated that GMP ∝ Y Ypopβ with β always greater than 1 and close to 1.2. This fundamental finding highlights a universal rule that holds across countries and cultures and might explain the very nature of cities. However, in an increasingly connected world, the hypothesis that the economy of a city solely depends on its population might be questionable. Using data for 248 cities in the European Union between 2005 and 2010, we found a double GMP/pop scaling regime. For West EU cities, β = 1 over the whole the period, while for post-communist cities β > 1 and increases from ∼1.2 to ∼1.4. The evolution of the scaling exponent describes the convergence of post-communist European cities to open and liberal economies. We propose a simple model of economic convergence in which, under stable political conditions, a linear GMP/pop scaling is expected for all cities. The results suggest that the GMP/pop super-linear scaling represents a phase of economic growth rather than a steady, universal urban feature. The results also suggest that relationships between cities are embedded in their political and economic context and cannot be neglected in explanations of cities, urbanization and urban economics.
Conflict of interest statement
The authors have declared that no competing interests exist.
Figures
References
-
- Bettencourt, L, Lobo, J, Hyejin, Y. The Hypothesis of Urban Scaling: Formalization, Implications and Challenges. SFI Working Paper. 2013;.
-
- Jacobs J. The life and death of great American cities; 1961.
-
- Jacobs J, The economy of cities The economy of cities. 1970;.
-
- Romer PM. Increasing returns and long-run growth. The journal of political economy. 1986; p. 1002–1037. 10.1086/261420 - DOI
MeSH terms
LinkOut - more resources
Full Text Sources
Other Literature Sources
