

Availability and Use of HIV Monitoring and Early Infant Diagnosis Technologies in WHO Member States in 2011-2013: Analysis of Annual Surveys at the Facility Level
- PMID: 27551917
- PMCID: PMC4995037
- DOI: 10.1371/journal.pmed.1002088
Availability and Use of HIV Monitoring and Early Infant Diagnosis Technologies in WHO Member States in 2011-2013: Analysis of Annual Surveys at the Facility Level
Abstract
Background: The Joint United Nations Programme on HIV and AIDS (UNAIDS) 90-90-90 targets have reinforced the importance of functioning laboratory services to ensure prompt diagnosis and to assess treatment efficacy. We surveyed the availability and utilization of technologies for HIV treatment monitoring and early infant diagnosis (EID) in World Health Organization (WHO) Member States.
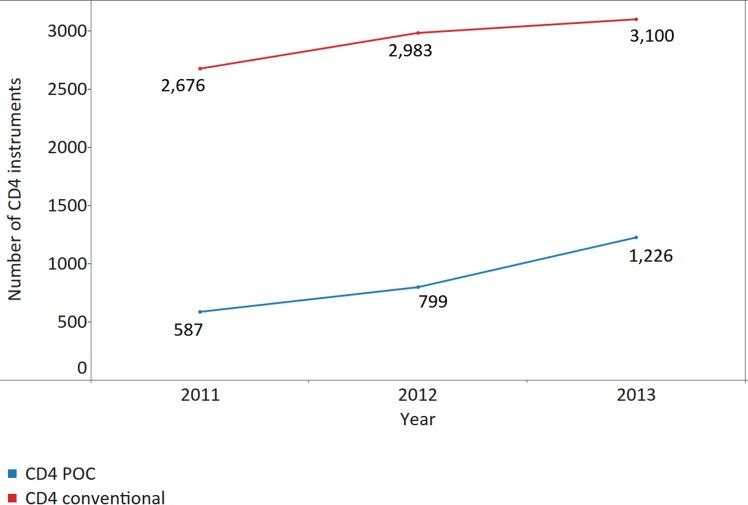
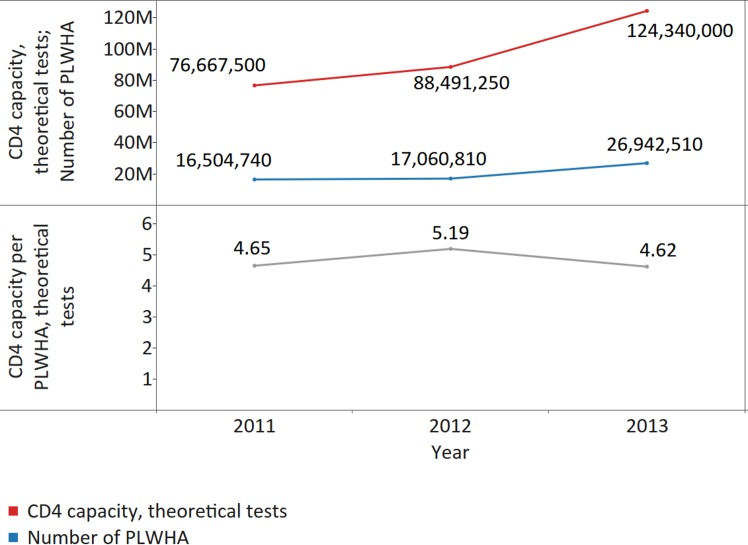
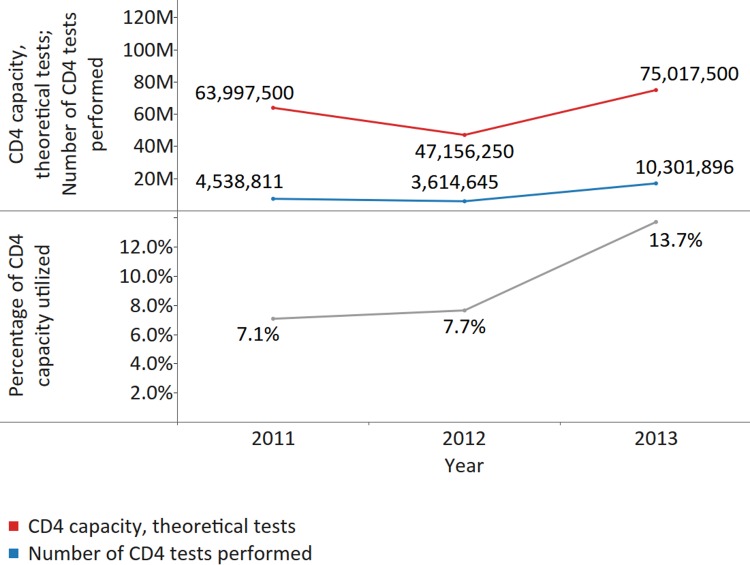
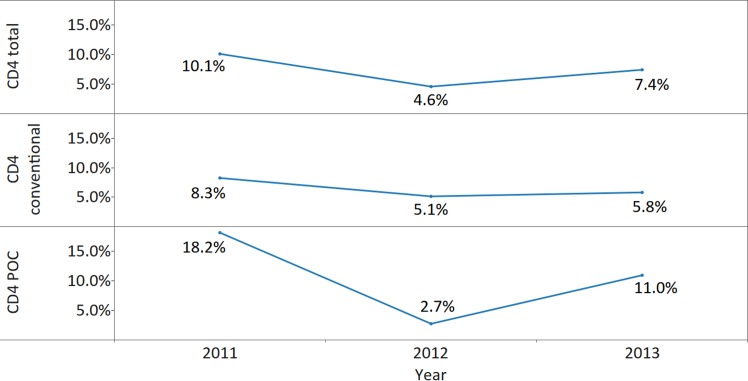
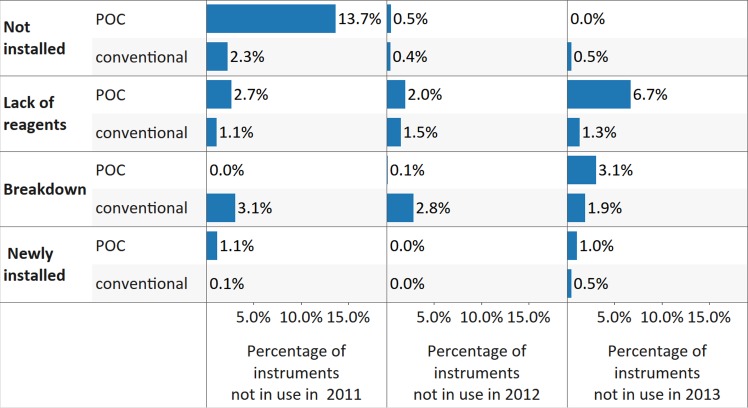
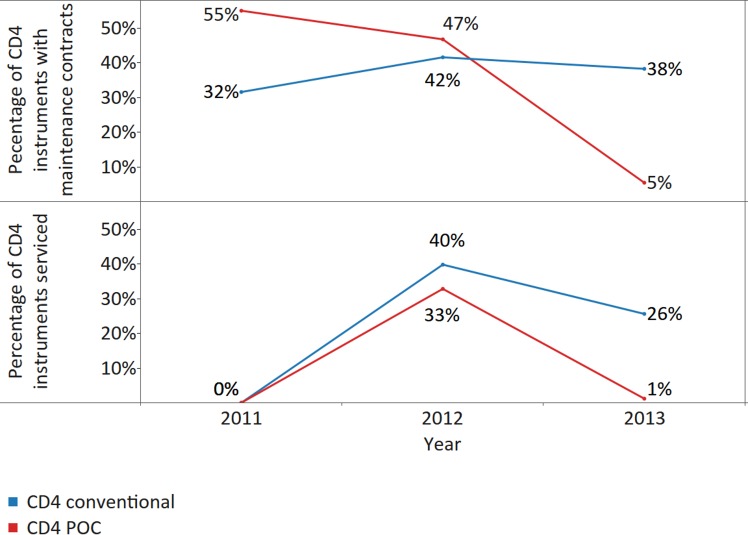
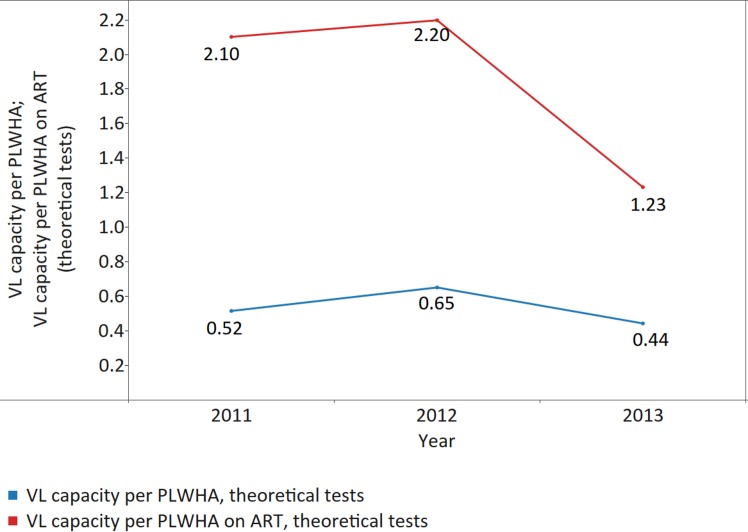
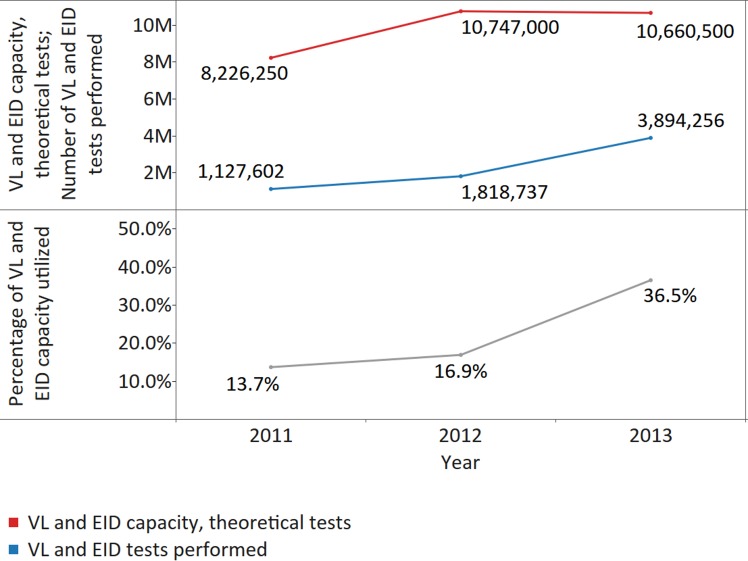
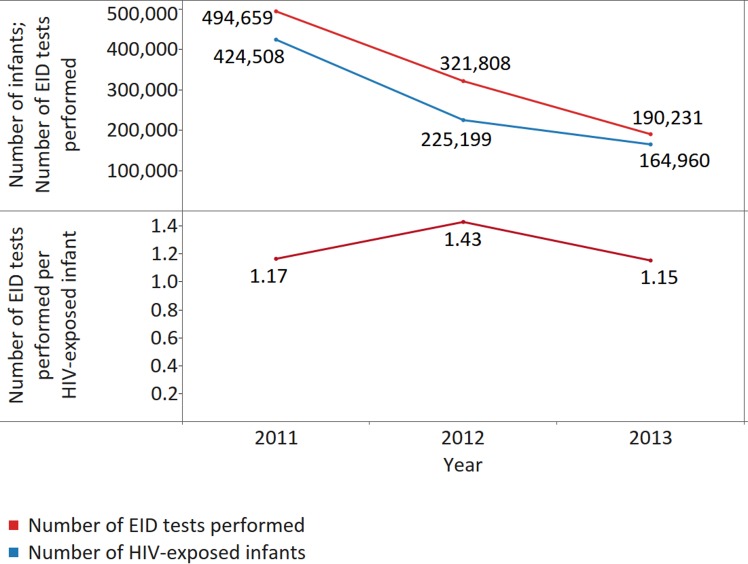
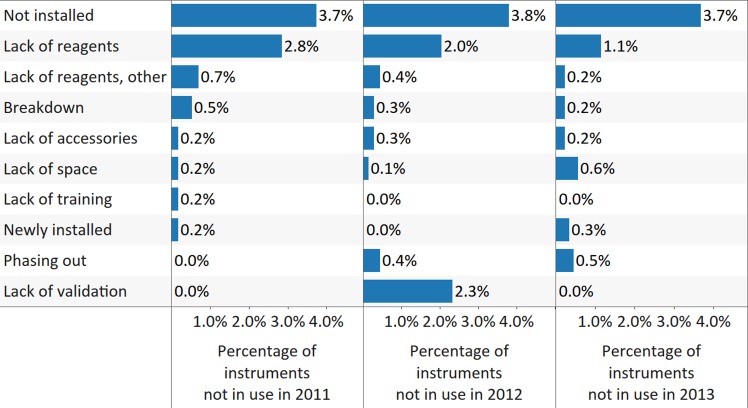
Methods and findings: The survey questionnaire included 14 structured questions focusing on HIV testing, cluster of differentiation 4 (CD4) testing, HIV viral load (VL) testing, and EID and was administered annually from 2012 to 2014 through WHO country offices, with each survey covering the previous 12-mo period. Across 127 targeted countries, survey response rates were 60% in 2012, 67% in 2013, and 78% in 2014. There were encouraging trends towards increased procurement of CD4 and VL/EID instruments in reporting countries. Globally, the capacity of available CD4 instruments was sufficient to meet the demand of all people living with HIV/AIDS (PLWHA), irrespective of treatment status (4.62 theoretical tests per PLWHA in 2013 [median 7.33; interquartile range (IQR) 3.44-17.75; median absolute deviation (MAD) 4.35]). The capacity of VL instruments was inadequate to cover all PLWHA in many reporting countries (0.44 tests per PLWHA in 2013 [median 0.90; IQR 0.30-2.40; MAD 0.74]). Of concern, only 13.7% of existing CD4 capacity (median 4.3%; IQR 1.1%-12.1%; MAD 3.8%) and only 36.5% of existing VL capacity (median 9.4%; IQR 2.3%-28.9%; MAD 8.2%) was being utilized across reporting countries in 2013. By the end of 2013, 7.4% of all CD4 instruments (5.8% CD4 conventional instruments and 11.0% of CD4 point of care [POC]) and 10% of VL/EID instruments were reportedly not in use because of lack of reagents, the equipment not being installed or deployed, maintenance, and staff training requirements. Major limitations of this survey included under-reporting and/or incomplete reporting in some national programmes and noncoverage of the private sector.
Conclusion: This is the first attempt to comprehensively gather information on HIV testing technology coverage in WHO Member States. The survey results suggest that major operational changes will need to be implemented, particularly in low- and middle-income countries, if the 90-90-90 targets are to be met.
Conflict of interest statement
The authors have declared that no competing interests exist.
Figures

Comment in
-
Progress and Challenges in Scaling Up Laboratory Monitoring of HIV Treatment.PLoS Med. 2016 Aug 23;13(8):e1002089. doi: 10.1371/journal.pmed.1002089. eCollection 2016 Aug. PLoS Med. 2016. PMID: 27551962 Free PMC article.
References
-
- Joint United Nations Programme on HIV/AIDS. Ambitious treatment targets: writing the final chapter of the AIDS epidemic. Geneva: UNAIDS; 2015. http://www.unaids.org/sites/default/files/media_asset/JC2670_UNAIDS_Trea.... Accessed 20 May 2016.
-
- World Health Organization. Guideline on when to start antiretroviral therapy and on pre-exposure prophylaxis for HIV. Geneva: WHO; 2015. http://apps.who.int/iris/bitstream/10665/186275/1/9789241509565_eng.pdf. Accessed 20 May 2016. - PubMed
-
- Joint United Nations Programme on HIV/AIDS. Diagnostic Access Initiative to achieve the 90-90-90 treatment targets. Geneva: UNAIDS; 2014. http://www.unaids.org/sites/default/files/media_asset/20150422_diagnosti.... Accessed 20 May 2016.
-
- World Health Organization; Consolidated guidelines on the use of antiretroviral drugs for treating and preventing HIV infection Recommendations for a public health approach. Geneva: WHO; 2013. http://www.who.int/hiv/pub/guidelines/arv2013/en/. Accessed 20 May 2016. - PubMed
Publication types
MeSH terms
Grants and funding
LinkOut - more resources
Full Text Sources
Other Literature Sources
Medical
Research Materials
Miscellaneous
