. 2016 Aug 23:7:12455.
doi: 10.1038/ncomms12455.

Sleep recalibrates homeostatic and associative synaptic plasticity in the human cortex

Affiliations

Sleep recalibrates homeostatic and associative synaptic plasticity in the human cortex

Marion Kuhn et al. Nat Commun. .

Abstract

Sleep is ubiquitous in animals and humans, but its function remains to be further determined. The synaptic homeostasis hypothesis of sleep-wake regulation proposes a homeostatic increase in net synaptic strength and cortical excitability along with decreased inducibility of associative synaptic long-term potentiation (LTP) due to saturation after sleep deprivation. Here we use electrophysiological, behavioural and molecular indices to non-invasively study net synaptic strength and LTP-like plasticity in humans after sleep and sleep deprivation. We demonstrate indices of increased net synaptic strength (TMS intensity to elicit a predefined amplitude of motor-evoked potential and EEG theta activity) and decreased LTP-like plasticity (paired associative stimulation induced change in motor-evoked potential and memory formation) after sleep deprivation. Changes in plasma BDNF are identified as a potential mechanism. Our study indicates that sleep recalibrates homeostatic and associative synaptic plasticity, believed to be the neural basis for adaptive behaviour, in humans.


Conflict of interest statement

Competing financial interests: D.R. has received a consulting fee from Abbvie Germany. C.No. has received speaker honoraria from Servier and Roche. He is an investigator in multicentre clinical trials sponsored by Otsuka, Lundbeck, Roche and Forum Pharmaceuticals. He received research support from Lundbeck and the German Ministry of Research and Education. C.Ni. has received speaker honoraria from Servier and Vanda Pharmaceuticals. The remaining authors declare no competing financial interests.

Figures

Figure 1
Figure 1. Indices of cortical excitability/net synaptic strength.
(a) Stimulation intensity of transcranial magnetic stimulation (% maximum stimulator output) was significantly lower after sleep deprivation compared with sleep. (b) Theta activity of wake electroencephalography (EEG) was significantly higher after the sleep deprivation compared with the sleep condition. Bars represent means (n=20). Individual data lines visualize the change between the two conditions at the single-subject level. Paired-sample t-tests were used (two-tailed): *P<0.05, ***P<0.001.
Figure 2
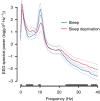
Figure 2. Electroencephalographic (EEG) spectral power.
After sleep deprivation, power density in the 3.5–8 Hz (theta) frequency range was significantly higher compared with the sleep condition (P<0.05). Exploratory analyses revealed condition effects in other frequency ranges. Solid lines represent means (n=20). Dashed lines represent 95% confidence intervals. Paired-sample t-tests were used (two-tailed). Horizontal lines indicate significant condition effects (P<0.05).
Figure 3
Figure 3. Indices of long-term potentiation (LTP)-like plasticity.
(a) After sleep deprivation, the inducibility of LTP-like plasticity was significantly impaired compared with the sleep condition, as measured by the increase in motor-evoked potential (MEP) amplitude 2 (post 1), 30 (post 2) and 60 min (post 3) after paired associative stimulation (PAS). Filled symbols indicate a significant (P<0.05) increase (after sleep) or decrease (after sleep deprivation) of post-PAS MEP amplitudes referred to baseline. (b) Response pattern to the PAS protocol at the single-subject level. Symbols represent the ratio of mean MEP amplitudes post-PAS (averaged across post 1–3) to MEP amplitudes before PAS (baseline) for each subject in both conditions. A ratio >1.0 indicates a LTP-like increase and a ratio <1.0 indicates a long-term depression (LTD)-like decrease in MEP amplitudes after PAS. Bars represent the cumulative number of participants who showed a LTP-like increase or LTD-like decrease in the sleep and the sleep deprivation condition, respectively. (c) The number of correctly recalled word-pairs in a declarative memory task was significantly lower after sleep deprivation compared with sleep. Data represent means±s.e.m. (n=20). Horizontal lines with asterisks indicate significant rm-ANOVAs (a,c) or a significant χ2-test (b). Paired-sample t-tests were used (two-tailed): *P<0.05, ***P=0.001.
Figure 4
Figure 4. Potential modulators of synaptic plasticity.
(a) Brain-derived neurotrophic factor (BDNF) plasma level was significantly lower after sleep deprivation compared with sleep. (b) After sleep deprivation, the participants were less vigilant, as indicated by a significant reduction in response speed (1,000 ms per reaction time) and a significant increase in the total number of lapses (reaction time ≥500 ms) in the Psychomotor Vigilance Task (PVT). Data represent means±s.e.m. (n=20). Paired-sample t-tests were used (two-tailed): **P<0.01, ***P<0.001.
Figure 5
Figure 5. ‘Happy medium' model of LTP inducibility across the sleep wake cycle.
The figure depicts the proposed interplay between the time course of synaptic strength/cortical excitability (homeostatic plasticity; solid and dotted lines) and the inducibility of associative synaptic long-term potentiation (LTP)-like plasticity (red window). Wakefulness is associated with an upscaling and sleep with a downscaling of net synaptic strength. Sleep deprivation eventually leads to synaptic saturation and deficient LTP inducibility.
Figure 6
Figure 6. Electrophysiological, behavioural and molecular assessments.
Measurements started at 6:45 AM with the wake electroencephalography (EEG) and Psychomotor Vigilance Task (PVT). At 0800, h, the TMS protocol was started consisting of a baseline measurement followed by paired associative stimulation (PAS) and three post measurements (2, 30 and 60 min after the end of PAS). Salivary cortisol was assessed at 0600, h and 0800, h. After the TMS measurement, 15 ml of blood was taken to determine brain-derived neurotrophic factor (BDNF) plasma concentration and BDNF genotype. Last, a declarative memory task (word-pair task) was conducted.
Figure 7
Figure 7. Raw examples of single motor-evoked potentials (MEPs).
Single MEPs of one participant were selected to illustrate the results. MEP amplitudes increased from baseline level after paired associative stimulation (PAS) in the sleep condition, whereas MEP amplitudes decreased from baseline level after PAS in the sleep deprivation condition.

References

    1. Turrigiano G. G. & Nelson S. B. Homeostatic plasticity in the developing nervous system. Nat. Rev. Neurosci. 5, 97–107 (2004). - PubMed
    1. Diekelmann S. & Born J. The memory function of sleep. Nat. Rev. Neurosci. 11, 114–126 (2010). - PubMed
    1. Tononi G. & Cirelli C. Sleep and synaptic homeostasis: a hypothesis. Brain Res. Bull. 62, 143–150 (2003). - PubMed
    1. Tononi G. & Cirelli C. Sleep function and synaptic homeostasis. Sleep Med. Rev. 10, 49–62 (2006). - PubMed
    1. Tononi G. & Cirelli C. Sleep and the price of plasticity: from synaptic and cellular homeostasis to memory consolidation and integration. Neuron 81, 12–34 (2014). - PMC - PubMed

LinkOut - more resources