. 2016 Nov;57(6):496-506.
doi: 10.1080/03008207.2016.1213247. Epub 2016 Aug 23.

The LG/J murine strain exhibits near-normal tendon biomechanical properties following a full-length central patellar tendon defect

Affiliations

The LG/J murine strain exhibits near-normal tendon biomechanical properties following a full-length central patellar tendon defect

Jessica R Arble et al. Connect Tissue Res. 2016 Nov.

Abstract

Purpose of the study: Identifying biological success criteria is needed to improve therapies, and one strategy for identifying them is to analyze the RNA transcriptome for successful and unsuccessful models of tendon healing. We have characterized the MRL/MpJ murine strain and found improved mechanical outcomes following a central patellar tendon (PT) injury. In this study, we evaluate the healing of the LG/J murine strain, which comprises 75% of the MRL/MpJ background, to determine if the LG/J also exhibits improved biomechanical properties following injury and to determine differentially expressed transcription factors across the C57BL/6, MRL/MpJ and the LG/J strains during the early stages of healing.

Materials and methods: A full-length, central PT defect was created in 16-20 week old MRL/MpJ, LG/J, and C57BL/6 murine strains. Mechanical properties were assessed at 2, 5, and 8 weeks post surgery. Transcriptomic expression was assessed at 3, 7, and 14 days following injury using a novel clustering software program to evaluate differential expression of transcription factors.

Results: Average LG/J structural properties improved to 96.7% and 97.2% of native LG/J PT stiffness and ultimate load by 8 weeks post surgery, respectively. We found the LG/J responded by increasing expression of transcription factors implicated in the inflammatory response and collagen fibril organization.

Conclusions: The LG/J strain returns to normal structural properties by 8 weeks, with steadily increasing properties at each time point. Future work will characterize the cell populations responding to injury and investigate the role of the differentially expressed transcription factors during healing.

Keywords: Biomechanical properties; mouse model; tendon healing; transcription factors; transcriptome.


Conflict of interest statement

DECLARATION OF INTEREST

The authors declare they have no actual or competing financial interests.

Figures

Figure 1
Figure 1
The native structural properties of the three strains are not significantly. Data for the C57BL/6 and MRL/MpJ obtained from Lalley et al.. Error bars represent SD.
Figure 2
Figure 2
Average failure curves for LG/J repaired tendon tissue and 2, 5, and 8 weeks post surgery. At two weeks, the repair is significantly weaker than native, however at 5 and 8 weeks there is no significant difference between the repair tissues and native. Error bars represent SD.
Figure 3
Figure 3
Structural and material properties of defect tendon tissues plotted as a percent of native for (a) ultimate load, (b) linear stiffness, (c) ultimate stress, and (d) modulus. The LG/J repair tissue exhibited improved structural and material properties between 5 and 8 weeks post surgery compared to both the MRL/MpJ and C57BL/6 murine strains. Error bars indicate SD. The MRL/MpJ data was collected and reported in a previous manuscript. * indicates the LG/J strain is different than both the C57BL/6 and MRL/MpJ strains. + indicates the LG/J strain is different than the C57BL/6 strain.
Figure 3
Figure 3
Structural and material properties of defect tendon tissues plotted as a percent of native for (a) ultimate load, (b) linear stiffness, (c) ultimate stress, and (d) modulus. The LG/J repair tissue exhibited improved structural and material properties between 5 and 8 weeks post surgery compared to both the MRL/MpJ and C57BL/6 murine strains. Error bars indicate SD. The MRL/MpJ data was collected and reported in a previous manuscript. * indicates the LG/J strain is different than both the C57BL/6 and MRL/MpJ strains. + indicates the LG/J strain is different than the C57BL/6 strain.
Figure 4
Figure 4
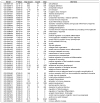
(+2, +2) GO terms and p-values (LG/J Time Comparison)
Figure 5
Figure 5
(−2, −2) GO terms and p-values (LG/J Time Comparison)
Figure 6
Figure 6
Figure 6a. Comparison of temporal gene expression patterns obtained from RNA-Seq and qPCR technologies for C57BL/6, MRL/MpJ and LG/J. Expression of collagen type I (Col1a1), collagen type III (Col3a1), scleraxis (Scx), and mohawk homeobox (Mkx) are represented. Overall, the temporal expression patterns measured using qPCR and RNASeq within each strain for each gene were similar. Fragments per exon kilobase per million mapped sequence reads (FPKM) values were plotted against the left y-axis (RNA-Seq output) and 1-Ct values were plotted against the right y-axis (qPCR output). Native tissue and time post-surgery are represented on the x-axis. Figure 6b. Comparison of temporal gene expression patterns obtained from RNA-Seq and qPCR technologies for C57BL/6, MRL/MpJ and LG/J. Expression of early growth response 1 (Egr1), tenascin-C (TnC), tenomodulin (Tnmd), and fibromodulin (Fmod) are represented. Overall, the temporal expression patterns measured using qPCR and RNASeq within each strain for each gene were similar. Fragments per exon kilobase per million mapped sequence reads (FPKM) values were plotted against the left y-axis (RNA-Seq output) and 1-Ct values were plotted against the right y-axis (qPCR output). Native tissue and time post-surgery are represented on the x-axis. Figure 6c. Comparison of temporal gene expression patterns obtained from RNA-Seq and qPCR technologies for C57BL/6, MRL/MpJ and LG/J. Expression of cyclin-dependent kinase inhibitor 1 (p21), v-myc avian myelocytomatosis viral oncogene homolog (Myc), decorin (Dcn), and interferon gamma (IFNG) are represented. Overall, the temporal expression patterns measured using qPCR and RNASeq within each strain for each gene were similar, with the exception of MRL/MpJ’s recorded IFNG expression. This can be attributed to low expression values for this gene with Ct values measured at the upper limits of the Taqman gene expression assay. Fragments per exon kilobase per million mapped sequence reads (FPKM) values were plotted against the left y-axis (RNA-Seq output) and 1-Ct values were plotted against the right y-axis (qPCR output). Native tissue and time post-surgery are represented on the x-axis. Figure 6d. Comparison of temporal gene expression patterns obtained from RNA-Seq and qPCR technologies for C57/BL6, MRL/MpJ, and LG/J. Expression of POU class5 homeobox 1 (Pou5f1) and homeobox A13 (Hoxa13) are represented. The temporal expression patterns for both Pou5f1 and Hoxa13 were different between the qPCR and RNA-Seq measures. This can be attributed to low expression values for these two genes with Ct values measured at the upper limits of the Taqman gene expression assay. Fragments per exon kilobase per million mapped sequence reads (FPKM) values were plotted against the left y-axis (RNA-Seq output) and 1-Ct values were plotted against the right y-axis (qPCR output). Native tissue and time post-surgery are represented on the x-axis.
Figure 6
Figure 6
Figure 6a. Comparison of temporal gene expression patterns obtained from RNA-Seq and qPCR technologies for C57BL/6, MRL/MpJ and LG/J. Expression of collagen type I (Col1a1), collagen type III (Col3a1), scleraxis (Scx), and mohawk homeobox (Mkx) are represented. Overall, the temporal expression patterns measured using qPCR and RNASeq within each strain for each gene were similar. Fragments per exon kilobase per million mapped sequence reads (FPKM) values were plotted against the left y-axis (RNA-Seq output) and 1-Ct values were plotted against the right y-axis (qPCR output). Native tissue and time post-surgery are represented on the x-axis. Figure 6b. Comparison of temporal gene expression patterns obtained from RNA-Seq and qPCR technologies for C57BL/6, MRL/MpJ and LG/J. Expression of early growth response 1 (Egr1), tenascin-C (TnC), tenomodulin (Tnmd), and fibromodulin (Fmod) are represented. Overall, the temporal expression patterns measured using qPCR and RNASeq within each strain for each gene were similar. Fragments per exon kilobase per million mapped sequence reads (FPKM) values were plotted against the left y-axis (RNA-Seq output) and 1-Ct values were plotted against the right y-axis (qPCR output). Native tissue and time post-surgery are represented on the x-axis. Figure 6c. Comparison of temporal gene expression patterns obtained from RNA-Seq and qPCR technologies for C57BL/6, MRL/MpJ and LG/J. Expression of cyclin-dependent kinase inhibitor 1 (p21), v-myc avian myelocytomatosis viral oncogene homolog (Myc), decorin (Dcn), and interferon gamma (IFNG) are represented. Overall, the temporal expression patterns measured using qPCR and RNASeq within each strain for each gene were similar, with the exception of MRL/MpJ’s recorded IFNG expression. This can be attributed to low expression values for this gene with Ct values measured at the upper limits of the Taqman gene expression assay. Fragments per exon kilobase per million mapped sequence reads (FPKM) values were plotted against the left y-axis (RNA-Seq output) and 1-Ct values were plotted against the right y-axis (qPCR output). Native tissue and time post-surgery are represented on the x-axis. Figure 6d. Comparison of temporal gene expression patterns obtained from RNA-Seq and qPCR technologies for C57/BL6, MRL/MpJ, and LG/J. Expression of POU class5 homeobox 1 (Pou5f1) and homeobox A13 (Hoxa13) are represented. The temporal expression patterns for both Pou5f1 and Hoxa13 were different between the qPCR and RNA-Seq measures. This can be attributed to low expression values for these two genes with Ct values measured at the upper limits of the Taqman gene expression assay. Fragments per exon kilobase per million mapped sequence reads (FPKM) values were plotted against the left y-axis (RNA-Seq output) and 1-Ct values were plotted against the right y-axis (qPCR output). Native tissue and time post-surgery are represented on the x-axis.

References

    1. The burden of musculoskeletal diseases in the united states (BMUS) 3. American Academy of Orthopaedic Surgeons;; 2014.
    1. Kaux J, Forthomme B, le Goff C, Crielaard J, Croisier J. Current opinions on tendinopathy. Journal of Sports Science and Medicine. 2011;10:238–253. - PMC - PubMed
    1. Awad HA, Boivin GP, Dressler MR, Smith FNL, Young RG, Butler DL. Repair of patellar tendon injuries using a cell-collagen composite. Journal of orthopaedic research : official publication of the Orthopaedic Research Society. 2003;21:420–31. - PubMed
    1. Dyment NA, Kazemi N, Aschbacher-Smith LE, Barthelery NJ, Kenter K, Gooch C, Shearn JT, Wylie C, Butler DL. The relationships among spatiotemporal collagen gene expression, histology, and biomechanics following full-length injury in the murine patellar tendon. Journal of Orthopaedic Research. 2012;30:28–36. - PMC - PubMed
    1. Bruns J, Kampen J, Kahrs J, Plitz W. Achilles tendon rupture: Experimental results on spontaneous repair in a sheep-model. Knee Surgery Sports Traumatology Arthroscopy. 2000;8:364–369. - PubMed

Publication types

LinkOut - more resources