Observational Study
. 2016 Aug;316(8):846-57.
doi: 10.1001/jama.2016.9207.

Association of RNA Biosignatures With Bacterial Infections in Febrile Infants Aged 60 Days or Younger

Collaborators, Affiliations
Observational Study

Association of RNA Biosignatures With Bacterial Infections in Febrile Infants Aged 60 Days or Younger

Prashant Mahajan et al. JAMA. 2016 Aug.

Erratum in

Abstract

Importance: Young febrile infants are at substantial risk of serious bacterial infections; however, the current culture-based diagnosis has limitations. Analysis of host expression patterns ("RNA biosignatures") in response to infections may provide an alternative diagnostic approach.

Objective: To assess whether RNA biosignatures can distinguish febrile infants aged 60 days or younger with and without serious bacterial infections.

Design, setting, and participants: Prospective observational study involving a convenience sample of febrile infants 60 days or younger evaluated for fever (temperature >38° C) in 22 emergency departments from December 2008 to December 2010 who underwent laboratory evaluations including blood cultures. A random sample of infants with and without bacterial infections was selected for RNA biosignature analysis. Afebrile healthy infants served as controls. Blood samples were collected for cultures and RNA biosignatures. Bioinformatics tools were applied to define RNA biosignatures to classify febrile infants by infection type.

Exposure: RNA biosignatures compared with cultures for discriminating febrile infants with and without bacterial infections and infants with bacteremia from those without bacterial infections.

Main outcomes and measures: Bacterial infection confirmed by culture. Performance of RNA biosignatures was compared with routine laboratory screening tests and Yale Observation Scale (YOS) scores.

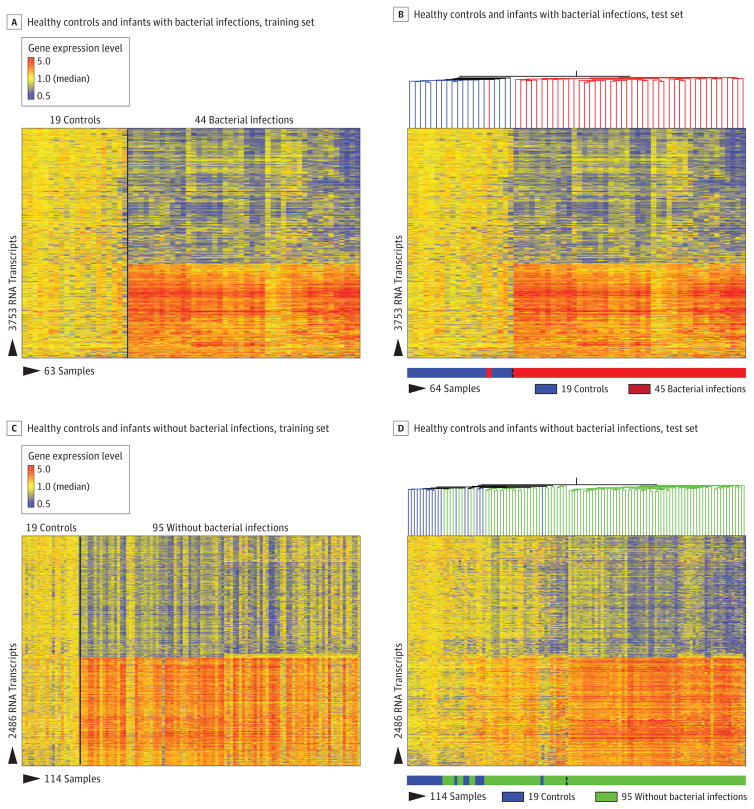
Results: Of 1883 febrile infants (median age, 37 days; 55.7% boys), RNA biosignatures were measured in 279 randomly selected infants (89 with bacterial infections-including 32 with bacteremia and 15 with urinary tract infections-and 190 without bacterial infections), and 19 afebrile healthy infants. Sixty-six classifier genes were identified that distinguished infants with and without bacterial infections in the test set with 87% (95% CI, 73%-95%) sensitivity and 89% (95% CI, 81%-93%) specificity. Ten classifier genes distinguished infants with bacteremia from those without bacterial infections in the test set with 94% (95% CI, 70%-100%) sensitivity and 95% (95% CI, 88%-98%) specificity. The incremental C statistic for the RNA biosignatures over the YOS score was 0.37 (95% CI, 0.30-0.43).

Conclusions and relevance: In this preliminary study, RNA biosignatures were defined to distinguish febrile infants aged 60 days or younger with vs without bacterial infections. Further research with larger populations is needed to refine and validate the estimates of test accuracy and to assess the clinical utility of RNA biosignatures in practice.


Conflict of interest statement

Disclosures: All authors have completed and submitted the ICMJE Form for Disclosure of Potential Conflicts of Interest. Dr Mejias reports receiving personal fees from Abbvie, Novartis, and Janssen and grants from Gilead, Alios, and Janssen. Dr Ramilo reports receiving personal fees from HuMabs, Abbvie, Janssen, Medimmune, and Regeneron and grants from Janssen. All these fees and grants were not related to the current work. No other disclosures were reported.

Figures

Figure 1
Figure 1. FlowDiagram of Enrollment and Allocation to Different Groups for Microarray Analyses
The same 19 healthy controls were used for both the bacterial and without bacteria biosignatures analyses. KNN indicates κ–nearest neighbors; UTI, urinary tract infection. aRNA samples selection strategy is described in detail in the Methods section. bTwo patients with bacteremia also had bacterial meningitis, one each in the training and test sets. cHealthy afebrile control infants enrolled during routine primary care visits or at the time of elective surgery were also included as comparators for the analyses.
Figure 2
Figure 2. RNA Biosignatures of Young Febrile Infants With and Without Bacterial Infections
For panels A and C, the heat map representing RNA biosignatures are identified by class comparisons by nonparametric test (Mann-Whitney test, P < .01), with the Benjamini-Hochberg multiple test correction and 1.25-fold change. Transcripts are represented in rows and infants are represented in columns. Color bars indicate the normalized gene expression level (red, overexpressed; blue, underexpressed) relative to the healthy control infants (yellow, median gene expression of the healthy controls). The scale indicates the relative-fold differences in gene expression levels. For panels B and D, the dendrogram branches of the gene tree structure are colored according to condition (blue, healthy controls; red, bacterial infection; green, without bacterial infection). Unsupervised hierarchical clustering (euclidean distance, average linkage) of the transcripts applied to a separate test set of infants. For these analyses, the computer algorithm groups the samples of patients and healthy controls according to the similarities in gene expression patterns; this is performed in a blinded fashion because the samples are not preassigned to the infection or control group.
Figure 3
Figure 3. Transcriptional Modular Analysis of Young Febrile Infants With and Without Bacterial Infections
Modular maps were derived independently for the training and test sets. Modules (groups of coordinately expressed genes with similar biological function) are shown as the percentage of genes in that particular module that are expressed significantly differently from healthy controls. They are represented as dots on a grid. Module functional annotation is indicated by the color-code legend key. The first row on the grid includes modules that were identified in the first round of selection, when the modules were first described (M1; subnetwork constituted of genes coclustering; the letter Mis used to name the modules). Modules that were identified in subsequent rounds of selection make up the next rows (M2, M3, M4, M5, M6). In this display only modules from the first 6 rounds of selection are shown because they are considered the most biologically relevant and have better functional characterization. A and B, the average modular transcriptional profile for patients with bacterial infections vs healthy controls is shown. C and D, the average modular transcriptional profile for patients without bacterial infections vs healthy controls.
Figure 4
Figure 4. Correlation of Training and Test Modular Profiles of Infants
The scatterplots represent the correlation between the modular expression of the training and test sets of the patients with bacterial infections. Red dots represent modules with significantly overexpressed genes; blue dots, significantly underexpressed genes vs healthy controls. Dots with no color indicate no significant differences in the expression of the genes included in that module vs healthy controls.
Figure 5
Figure 5. Discrimination of Febrile Infants With and Without Bacterial Infections by Classifier Genes
The rectangles located on the top of the heat maps represent the patient’s classification according to standard bacterial cultures in dark colors (red for patients with bacterial infections and green for patients without bacterial infections) and below according to the κ–nearest neighbors (KNN) algorithm in light colors (white represents the patients not classified by the KNN algorithm). The arrows located at the bottom of the heat maps indicate the transcriptional profiles of 3 patients (2 in panel C and 1 panel D) with positive blood cultures for viridans streptococcus. The profiles of these 3 patients appear visually different from those of most other patients with bacteremia. A, Application of the KNN algorithm to the training set composed of febrile infants with and without bacterial infections identified classifier genes (listed in eTable 3 in the Supplement) that best discriminated the 2 groups. B. The accuracy of the classifier genes was confirmed in an independent test set of patients with and without bacterial infections. The heat maps represent the expression levels of the classifier genes in the training and test sets. Overexpressed transcripts are shown in red and underexpressed transcripts in blue. Genes are ordered in the heat map from top to bottom according to their ability to discriminate between the groups. A similar approach was followed to identify classifier genes to discriminate infants with bacteremia and those without bacterial infections. C, The KNN algorithm identified the classifier genes (listed in eTable 4 in the Supplement) in the training set composed of infants with bacteremia and those without bacterial infections that best discriminated the 2 groups. D, The accuracy of the classifier genes was confirmed in an independent test set of patients with bacteremia and without bacterial infections. The heat maps represent the expression levels of the classifier genes in the training and test sets.

Comment in

References

    1. Byington CL, Rittichier KK, Bassett KE, et al. Serious bacterial infections in febrile infants younger than 90 days of age: the importance of ampicillin-resistant pathogens. Pediatrics. 2003;111(5 pt 1):964–968. - PubMed
    1. DeAngelis C, Joffe A, Wilson M, Willis E. Iatrogenic risks and financial costs of hospitalizing febrile infants. Am J Dis Child. 1983;137(12):1146–1149. - PubMed
    1. Cummings CA, Relman DA. Microbial forensics—“cross-examining pathogens. ” Science. 2002;296(5575):1976–1979. - PubMed
    1. Wilson ML. Clinically relevant, cost-effective clinical microbiology: strategies to decrease unnecessary testing. Am J Clin Pathol. 1997;107(2):154–167. - PubMed
    1. Zwang O, Albert RK. Analysis of strategies to improve cost-effectiveness of blood cultures. J Hosp Med. 2006;1(5):272–276. - PubMed

Publication types

MeSH terms