. 2016 Aug 24;17(1):317.
doi: 10.1186/s12859-016-1168-5.

The tumor as an organ: comprehensive spatial and temporal modeling of the tumor and its microenvironment

Affiliations

The tumor as an organ: comprehensive spatial and temporal modeling of the tumor and its microenvironment

Naamah Bloch et al. BMC Bioinformatics. .

Abstract

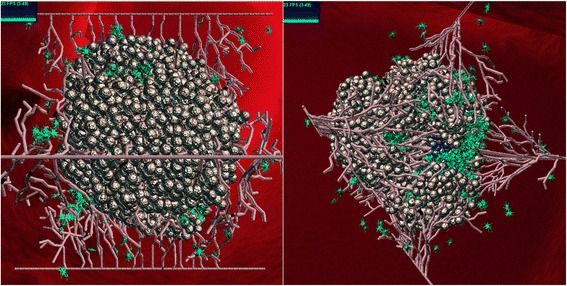
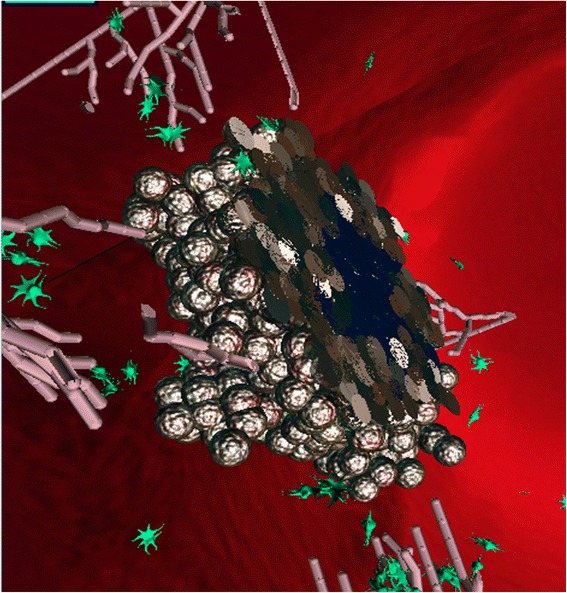
Background: Research related to cancer is vast, and continues in earnest in many directions. Due to the complexity of cancer, a better understanding of tumor growth dynamics can be gleaned from a dynamic computational model. We present a comprehensive, fully executable, spatial and temporal 3D computational model of the development of a cancerous tumor together with its environment.

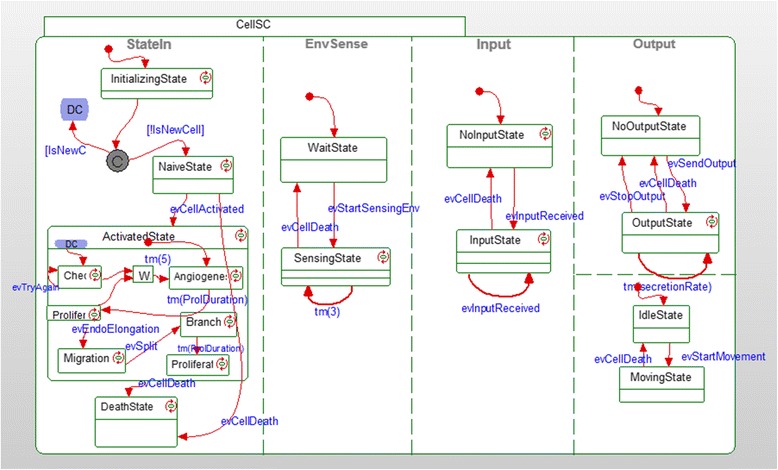
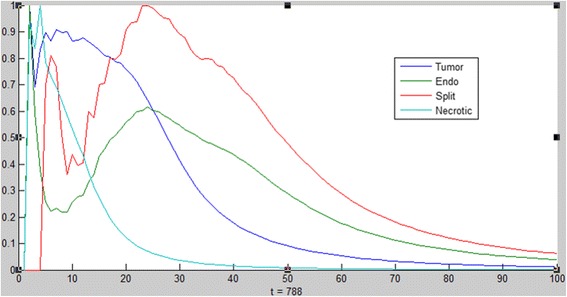
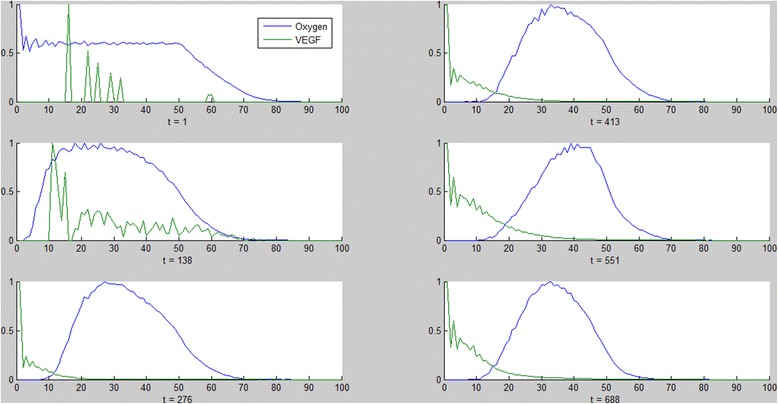
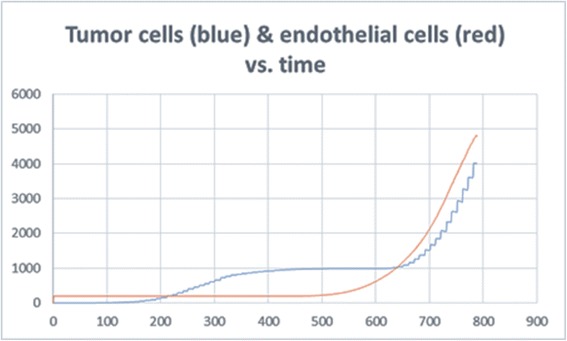
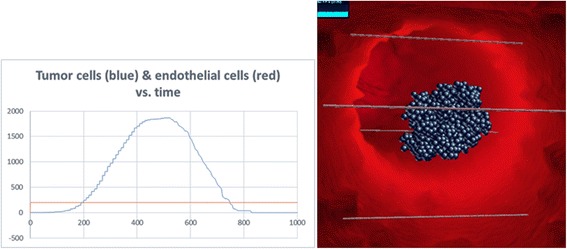
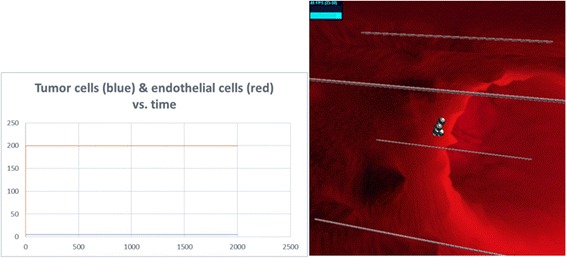
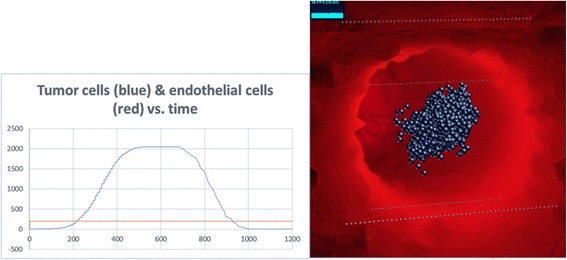
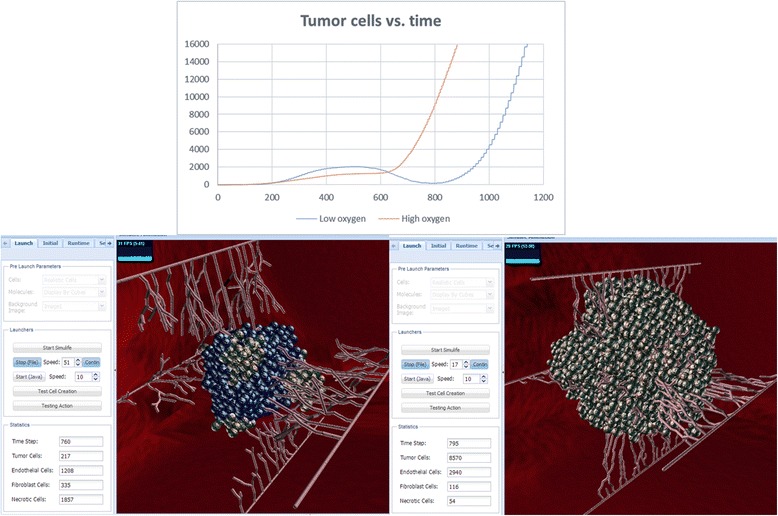
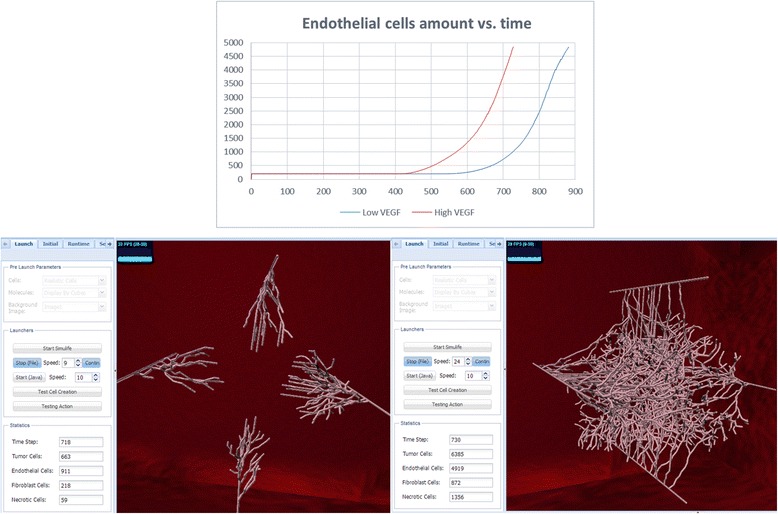
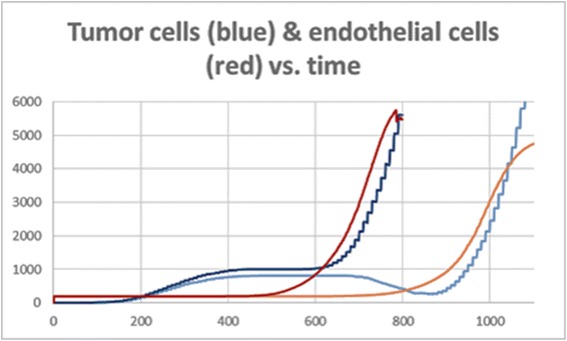
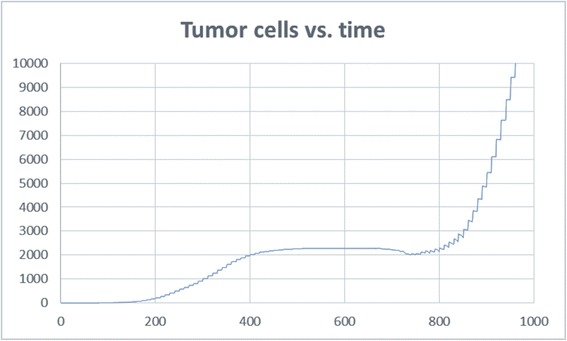
Results: The model was created using Statecharts, which were then connected to an interactive animation front-end that we developed especially for this work, making it possible to visualize on the fly the on-going events of the system's execution, as well as the effect of various input parameters. We were thus able to gain a better understanding of, e.g., how different amounts or thresholds of oxygen and VEGF (vascular endothelial growth factor) affect the progression of the tumor. We found that the tumor has a critical turning point, where it either dies or recovers. If minimum conditions are met at that time, it eventually develops into a full, active, growing tumor, regardless of the actual amount; otherwise it dies.

Conclusions: This brings us to the conclusion that the tumor is in fact a very robust system: changing initial values of VEGF and oxygen can increase the time it takes to become fully developed, but will not necessarily completely eliminate it.

Keywords: Biological systems; Computational models; Statecharts; Tumor and its microenvironment; Visualization.


Figures

Fig. 1
Fig. 1
Statechart of a cell. An example of a statechart that was used in the model
Fig. 2
Fig. 2
SimuLife image of the tumor. A SimuLife image of the tumor surrounded by vessels and fibroblasts (green) as created by the Statecharts model. Shown from two different angles
Fig. 3
Fig. 3
Slicing of the tumor in SimuLife; the necrotic core (dark blue) can be seen
Fig. 4
Fig. 4
Distribution of cells. Distribution of the different cells as a function of the distance from the center of the tumor (x = 0) at time step 788. Necrotic cells (light blue) occur at the center of the tumor. Vessel splits (red) occur more as they approach the tumor (blue)
Fig. 5
Fig. 5
Distribution of molecules. Distribution of oxygen (blue) and VEGF molecules (green) as a function of the distance from the center of the tumor (x = 0) at different time steps throughout the simulation (left column followed by right column, from top to bottom). Oxygen is initially present everywhere but is gradually consumed by the tumor and in parallel secreted by vessels. VEGF is secreted by the tumor and spreads out while being consumed by the endothelial cells. The VEGF in the first two graphs is due to secretion by fibroblasts and not by the tumor
Fig. 6
Fig. 6
Tumor cell and endothelial cell dynamics in the simulation. The behavior of the tumor cells and vessels in the model can be compared to biological results
Fig. 7
Fig. 7
No angiogenesis. Tumor does not develop. Left: tumor cell and endothelial cell dynamics. Right: image of the same run in SimuLife (blue cells are necrotic)
Fig. 8
Fig. 8
No angiogenesis. Non-cancerous and non-proliferating cells live on. Left: tumor cell and endothelial cell dynamics. Right: image of the same run in SimuLife
Fig. 9
Fig. 9
Initial blood vessels are too far away. Tumor does not develop. Left: tumor cell and endothelial cell dynamics. Right: image of the same run in SimuLife (blue cells are necrotic)
Fig. 10
Fig. 10
High vs. low oxygen secretion simulations. Top: graph of tumor cells showing that at a low oxygen level the tumor cells drop to almost zero at ~800ts but recover and reach 16,000 cells at ~1100ts, whereas at a high oxygen level they do not demonstrate a drop and reach 16,000 cells shortly after ~800ts. Bottom: images of these runs in SimuLife (left for low oxygen, right for high oxygen), presenting amounts on their left tab. Both images are presented at approximately the same time step – at low oxygen only few active tumor cells are present, at high oxygen the tumor consists of many cells where almost all are active
Fig. 11
Fig. 11
High vs. low VEGF secretion simulations. Top: graph of endothelial cells showing that at low VEGF the endothelial cells are activated at ~600ts and reach ~5000 cells at ~900ts, much later than at high VEGF secretion, which begins at ~400ts and reaches ~5000 cells at ~700ts. Bottom: images of these runs in SimuLife (left for low VEGF, right for high VEGF), presenting amounts on their left tab. Both images are presented at approximately the same time step–at low VEGF angiogenesis has only begun, whereas at high VEGF there are many activated and branched vessels
Fig. 12
Fig. 12
High vs. low angiogenic switch threshold simulations. Graph of tumor cells and endothelial cells at low angiogenic switch threshold (light colors), and high angiogenic switch thresholds (dark colors). They reach approximately the same levels, but at a time shift of ~200ts. Also, at high angiogenic thresholds we see that the tumor almost dies at ~900ts, but then recovers
Fig. 13
Fig. 13
Tumor cell dynamics. Just before 800ts there is a turning point for the tumor and a phase transition

References

    1. Kalluri R, Zeisberg M. Fibroblasts in cancer. Nat Rev Cancer. 2006;6(5):392–401. doi: 10.1038/nrc1877. - DOI - PubMed
    1. Hanahan D, Weinberg RA. The hallmarks of cancer. Cell. 2000;100(1):57–70. doi: 10.1016/S0092-8674(00)81683-9. - DOI - PubMed
    1. Hanahan D, Weinberg RA. Hallmarks of cancer: the next generation. Cell. 2011;144(5):646–74. doi: 10.1016/j.cell.2011.02.013. - DOI - PubMed
    1. Witz IP, Levy-Nissenbaum O. The tumor microenvironment in the post-PAGET era. Cancer Lett. 2006;242(1):1–10. doi: 10.1016/j.canlet.2005.12.005. - DOI - PubMed
    1. Tlsty TD, Coussens LM. Tumor stroma and regulation of cancer development. Annu Rev Pathol. 2006;1:119–50. doi: 10.1146/annurev.pathol.1.110304.100224. - DOI - PubMed

Substances

LinkOut - more resources