

Ex-vivo characterization of regulatory T cells in pulmonary tuberculosis patients, latently infected persons, and healthy endemic controls
- PMID: 27553411
- PMCID: PMC5111553
- DOI: 10.1016/j.tube.2016.06.007
Ex-vivo characterization of regulatory T cells in pulmonary tuberculosis patients, latently infected persons, and healthy endemic controls
Abstract
Background: Regulatory T cells (Treg) are an essential arm of adaptive immunity not only in tolerance and autoimmunity but also in infectious diseases. In Tuberculosis (TB), it has been suggested that the frequency of Tregs is higher in the blood of TB patients when compared to healthy controls with subsequent decline after treatment. However, with the discovery that FOXP3, the hallmark marker of Tregs, is not exclusive to Tregs and the lack of specific markers for Tregs, it has been a challenge to fully understand the role of Tregs in TB.
Method: We isolated PBMC from smear positive TB patients (TB, N = 13) before and after treatment, latent TB infected participants (LTBI, N = 8), and healthy endemic controls (EC, N = 9) and evaluated the frequency of different populations of Tregs and expression of FOXP3 by flowcytometry using six markers.
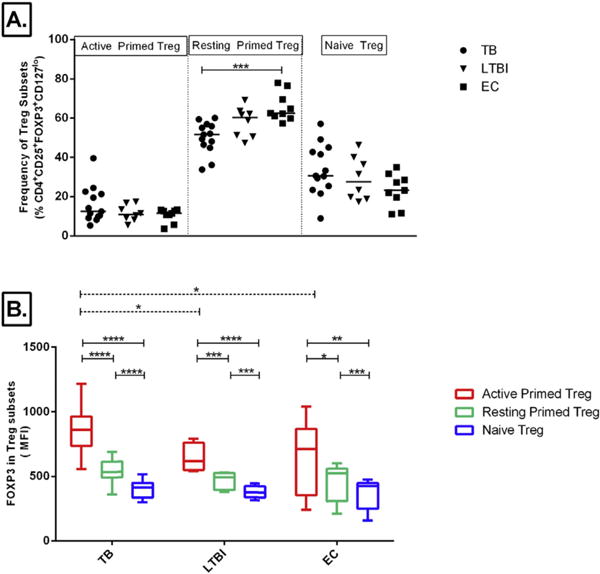
Results: The findings in this study showed that the association of Treg frequency with TB disease depends on the phenotypic markers used. While the frequency of CD4(+)CD25(+/hi) T cells was higher in TB patients compared to LTBI individuals, there was no difference in the frequency of CD4(+)CD25(+)FOXP3(+)CD127(lo) Treg among TB, LTBI, or EC. However, delineation of Tregs into active and naïve subsets revealed a significant increase in FOXP3 expression in active primed Tregs (CD4(+)CD25(+)FOXP3(+)CD127(lo)CD45RO(+)Ki-67(+)) of TB patients compared to LTBI and EC; and a significantly higher frequency of resting primed (CD45RO(+)Ki-67(-)) Treg in QuantiFERON negative EC compared to TB patients. After treatment completion, there was a significant decline in the frequency of active primed Treg, median (IQR) from 12.4% (9.5-21.9) of Tregs to 9.3% (7.0-12.2); P = 0.003 Wilcoxon signed rank test. We conclude that Treg subsets may be differentially regulated and expressed in TB disease, cure, and infection.
Keywords: FOXP3; Regulatory T cells; Tuberculosis.
Copyright © 2016 Elsevier Ltd. All rights reserved.
Conflict of interest statement
Conflicts of Interest: None declared.
Figures


References
-
- Fox GJ, Menzies D. Epidemiology of tuberculosis immunology. Adv Exp Med Biol. 2013;783:1–32. - PubMed
-
- Sakaguchi S. Naturally arising FOXP3-expressing CD25+CD4+ regulatory T cells in immunological tolerance to self and non-self. Nat Immunol. 2005;6(4):345–52. - PubMed
-
- Baecher-Allan C, Brown JA, Freeman GJ, Hafler DA. CD4+CD25 high regulatory cells in human peripheral blood. J Immunol. 2001;167(3):1245–53. - PubMed
-
- Fontenot JD, Gavin MA, Rudensky AY. FOXP3 programs the development and function of CD4+CD25+ regulatory T cells. Nat Immunol. 2003;4(4):330–6. - PubMed
-
- Hori S, Nomura T, Sakaguchi S. Control of regulatory T cell development by the transcription factor FOXP3. Science. 2003;299:1057–61. - PubMed
Publication types
MeSH terms
Substances
Grants and funding
LinkOut - more resources
Full Text Sources
Other Literature Sources
Research Materials
