. 2016 Aug 23;17(1):315.
doi: 10.1186/s12859-016-1176-5.

FastProject: a tool for low-dimensional analysis of single-cell RNA-Seq data

Affiliations

FastProject: a tool for low-dimensional analysis of single-cell RNA-Seq data

David DeTomaso et al. BMC Bioinformatics. .

Abstract

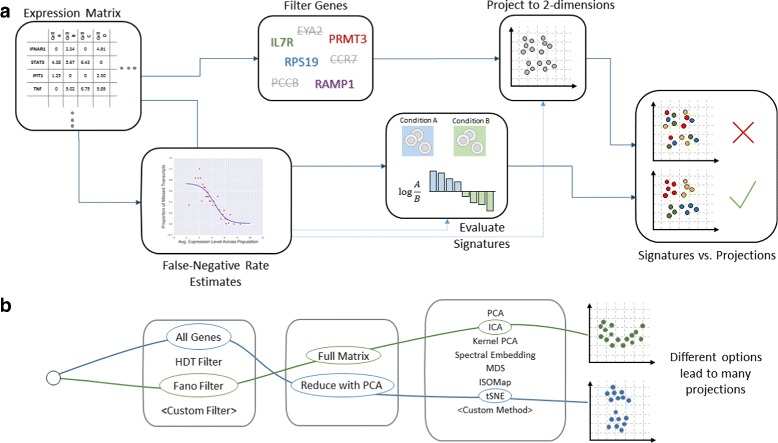
Background: A key challenge in the emerging field of single-cell RNA-Seq is to characterize phenotypic diversity between cells and visualize this information in an informative manner. A common technique when dealing with high-dimensional data is to project the data to 2 or 3 dimensions for visualization. However, there are a variety of methods to achieve this result and once projected, it can be difficult to ascribe biological significance to the observed features. Additionally, when analyzing single-cell data, the relationship between cells can be obscured by technical confounders such as variable gene capture rates.

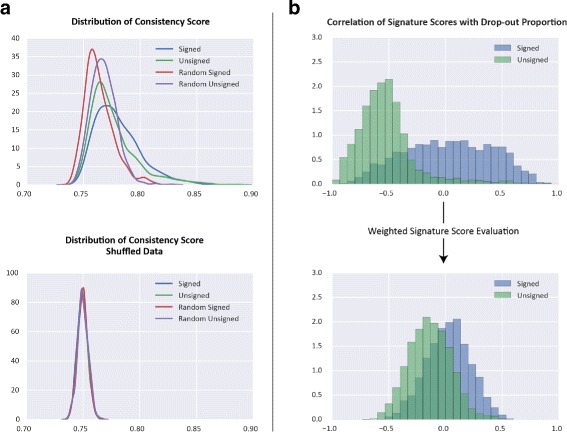
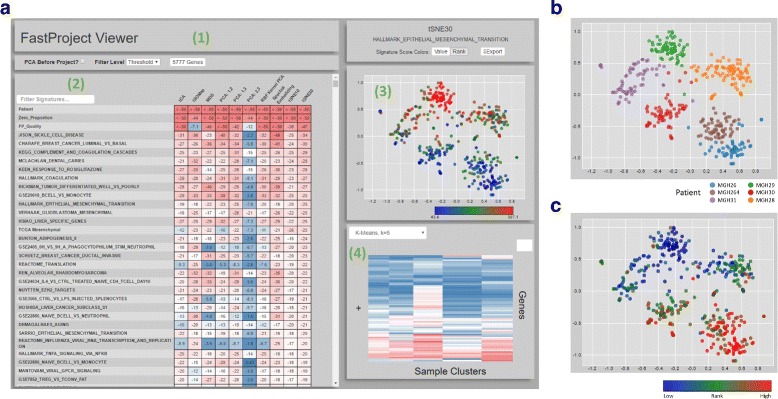
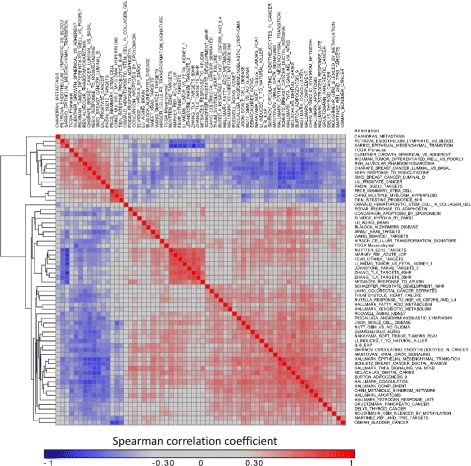
Results: To aid in the analysis and interpretation of single-cell RNA-Seq data, we have developed FastProject, a software tool which analyzes a gene expression matrix and produces a dynamic output report in which two-dimensional projections of the data can be explored. Annotated gene sets (referred to as gene 'signatures') are incorporated so that features in the projections can be understood in relation to the biological processes they might represent. FastProject provides a novel method of scoring each cell against a gene signature so as to minimize the effect of missed transcripts as well as a method to rank signature-projection pairings so that meaningful associations can be quickly identified. Additionally, FastProject is written with a modular architecture and designed to serve as a platform for incorporating and comparing new projection methods and gene selection algorithms.

Conclusions: Here we present FastProject, a software package for two-dimensional visualization of single cell data, which utilizes a plethora of projection methods and provides a way to systematically investigate the biological relevance of these low dimensional representations by incorporating domain knowledge.

Keywords: Dimensionality reduction; RNA-Seq; Single-Cell.


Figures

Fig. 1
Fig. 1
The FastProject pipeline. a Diagram describing the FastProject pipeline. A gene expression matrix is taken as input (left), and the resulting output report (right) combines low dimensional-representations of the input with gene signatures to highlight signatures which best explain features in the data. b Configurations for the projection that can be selected among in the output report
Fig. 2
Fig. 2
Behavior of Signature Scores. Behavior of signature scores calculated on the human glioblastoma scRNA-seq data from Patel et al., 2014 [2]. a Distribution of Signature/Projection consistency scores across four different types of signatures, Signed (signed immunological signatures from MSigDB), Unsigned (various unsigned hallmark and pathway signatures from MSigDB), Random Signed (signed signatures with randomly selected genes), and Random Unsigned (unsigned signatures with randomly selected genes). Lower panel shows distributions from the same signatures, run on data in which gene expression levels have been shuffled within each cell. Comparing these, it can be seen that biological signatures tend to have higher consistency scores than random signatures and this distinction disappears using shuffled data. b Distribution of the Pearson’s correlation coefficient between signature scores and a confounding variable - the proportion of undetected genes in a sample. Upper plot shows correlations when signature are calculated by simply taking the unweighted average of log expression level for genes in the signature. Lower panel shows the effect of using the weighted method presented here
Fig. 3
Fig. 3
FastProject Output Report. a Screenshot of FastProject interactive output report. 1) Controls for changing which genes were used when generating the projection and whether or not PCA was applied first. 2) Table displaying significance of the consistency score for each signature/projection pairing. Each row represents a signature and each column, a projection method. Clicking a cell in the table selects a signature and projection. 3) Scatter plot showing the selected projection annotated (color) with signature scores from the selected signature. 4) Heatmap showing average expression level of genes within each cluster. The clustering method can be changed through the dropdown menu in the same panel. b Corresponding scatterplot when selecting projection tSNE30 and the Patient signature. c Scatterplot for a signature representing response to the PPAR γ agonist rosiglitazone
Fig. 4
Fig. 4
Discovering Correlations between Signatures. FastProject makes its data amenable to further analysis by outputting signature scores and projection coordinates in text format. Shown here is a covariance matrix between top-ranked signatures (p<10−15 for at least one projection method) after removing overlapping signatures (J a c c a r d c o e f f i c i e n t>30 %) revealing signatures with similar patterns of expression

References

    1. Shalek AK, Satija R, Shuga J, Trombetta JJ, Gennert D, Lu D, Chen P, Gertner RS, Gaublomme JT, Yosef N, Schwartz S, Fowler B, Weaver S, Wang J, Wang X, Ding R, Raychowdhury R, Friedman N, Hacohen N, Park H, May AP, Regev A. Single-cell RNA-seq reveals dynamic paracrine control of cellular variation. Nature. 2014;509(7505):363–9. - PMC - PubMed
    1. Patel AP, Tirosh I, Trombetta JJ, Shalek AK, Gillespie SM, Wakimoto H, Cahill DP, Nahed BV, Curry WT, Martuza RL, Louis DN, Rozenblatt-Rosen O, Suvà ML, Regev A, Bernstein BE. Single-cell RNA-seq highlights intratumoral heterogeneity in primary glioblastoma. Science (New York) 2014;344(6190):1396–401. doi: 10.1126/science.1254257. - DOI - PMC - PubMed
    1. Trapnell C, Cacchiarelli D, Grimsby J, Pokharel P, Li S, Morse M, Lennon NJ, Livak KJ, Mikkelsen TS, Rinn JL. The dynamics and regulators of cell fate decisions are revealed by pseudotemporal ordering of single cells. Nat Biotechnol. 2014;32(4):381–6. doi: 10.1038/nbt.2859. - DOI - PMC - PubMed
    1. Satija R, Farrell JA, Gennert D, Schier AF, Regev A. Spatial reconstruction of single-cell gene expression data. Nat Biotechnol. 2015;33(5):495–502. doi: 10.1038/nbt.3192. - DOI - PMC - PubMed
    1. Buettner F, Natarajan KN, Casale FP, Proserpio V, Scialdone A, Theis FJ, Teichmann SA, Marioni JC, Stegle O. Computational analysis of cell-to-cell heterogeneity in single-cell RNA-sequencing data reveals hidden subpopulations of cells. Nat Biotechnol. 2015;33(2):155–60. doi: 10.1038/nbt.3102. - DOI - PubMed

Substances