

Stepwise iterative maximum likelihood clustering approach
- PMID: 27553625
- PMCID: PMC4995791
- DOI: 10.1186/s12859-016-1184-5
Stepwise iterative maximum likelihood clustering approach
Abstract
Background: Biological/genetic data is a complex mix of various forms or topologies which makes it quite difficult to analyze. An abundance of such data in this modern era requires the development of sophisticated statistical methods to analyze it in a reasonable amount of time. In many biological/genetic analyses, such as genome-wide association study (GWAS) analysis or multi-omics data analysis, it is required to cluster the plethora of data into sub-categories to understand the subtypes of populations, cancers or any other diseases. Traditionally, the k-means clustering algorithm is a dominant clustering method. This is due to its simplicity and reasonable level of accuracy. Many other clustering methods, including support vector clustering, have been developed in the past, but do not perform well with the biological data, either due to computational reasons or failure to identify clusters.
Results: The proposed SIML clustering algorithm has been tested on microarray datasets and SNP datasets. It has been compared with a number of clustering algorithms. On MLL datasets, SIML achieved highest clustering accuracy and rand score on 4/9 cases; similarly on SRBCT dataset, it got for 3/5 cases; on ALL subtype it got highest clustering accuracy for 5/7 cases and highest rand score for 4/7 cases. In addition, SIML overall clustering accuracy on a 3 cluster problem using SNP data were 97.3, 94.7 and 100 %, respectively, for each of the clusters.
Conclusions: In this paper, considering the nature of biological data, we proposed a maximum likelihood clustering approach using a stepwise iterative procedure. The advantage of this proposed method is that it not only uses the distance information, but also incorporate variance information for clustering. This method is able to cluster when data appeared in overlapping and complex forms. The experimental results illustrate its performance and usefulness over other clustering methods. A Matlab package of this method (SIML) is provided at the web-link http://www.riken.jp/en/research/labs/ims/med_sci_math/ .
Figures
 and
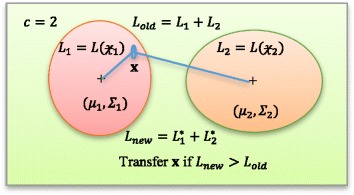
and  are given with likelihood functions L1 and L2, respectively. The center of clusters are depicted by μ
1 and μ
2 (shown as ‘+’ inside two clusters). Initial total likelihood is Lold which is the sum of two likelihood functions (L1 + L2). A sample
are given with likelihood functions L1 and L2, respectively. The center of clusters are depicted by μ
1 and μ
2 (shown as ‘+’ inside two clusters). Initial total likelihood is Lold which is the sum of two likelihood functions (L1 + L2). A sample
 is checked for grouping. It is advantageous to shift sample to cluster
  only if the new likelihood (Lnew = L
1* + L
2*) is higher than the old likelihood; i.e., L
new > L
old
only if the new likelihood (Lnew = L
1* + L
2*) is higher than the old likelihood; i.e., L
new > L
old


Similar articles
-
2D-EM clustering approach for high-dimensional data through folding feature vectors.BMC Bioinformatics. 2017 Dec 28;18(Suppl 16):547. doi: 10.1186/s12859-017-1970-8. BMC Bioinformatics. 2017. PMID: 29297298 Free PMC article.
-
Hierarchical Maximum Likelihood Clustering Approach.IEEE Trans Biomed Eng. 2017 Jan;64(1):112-122. doi: 10.1109/TBME.2016.2542212. Epub 2016 Mar 24. IEEE Trans Biomed Eng. 2017. PMID: 27046867
-
Divisive hierarchical maximum likelihood clustering.BMC Bioinformatics. 2017 Dec 28;18(Suppl 16):546. doi: 10.1186/s12859-017-1965-5. BMC Bioinformatics. 2017. PMID: 29297297 Free PMC article.
-
Detecting clusters of different geometrical shapes in microarray gene expression data.Bioinformatics. 2005 May 1;21(9):1927-34. doi: 10.1093/bioinformatics/bti251. Epub 2005 Jan 12. Bioinformatics. 2005. PMID: 15647300
-
A ground truth based comparative study on clustering of gene expression data.Front Biosci. 2008 May 1;13:3839-49. doi: 10.2741/2972. Front Biosci. 2008. PMID: 18508478 Free PMC article. Review.
Cited by
-
2D-EM clustering approach for high-dimensional data through folding feature vectors.BMC Bioinformatics. 2017 Dec 28;18(Suppl 16):547. doi: 10.1186/s12859-017-1970-8. BMC Bioinformatics. 2017. PMID: 29297298 Free PMC article.
-
PCA via joint graph Laplacian and sparse constraint: Identification of differentially expressed genes and sample clustering on gene expression data.BMC Bioinformatics. 2019 Dec 30;20(Suppl 22):716. doi: 10.1186/s12859-019-3229-z. BMC Bioinformatics. 2019. PMID: 31888433 Free PMC article.
-
Review of Statistical Learning Methods in Integrated Omics Studies (An Integrated Information Science).Bioinform Biol Insights. 2018 Feb 20;12:1177932218759292. doi: 10.1177/1177932218759292. eCollection 2018. Bioinform Biol Insights. 2018. PMID: 29497285 Free PMC article. Review.
-
Integration of Meta-Multi-Omics Data Using Probabilistic Graphs and External Knowledge.Cells. 2023 Aug 4;12(15):1998. doi: 10.3390/cells12151998. Cells. 2023. PMID: 37566077 Free PMC article.
-
An improved discriminative filter bank selection approach for motor imagery EEG signal classification using mutual information.BMC Bioinformatics. 2017 Dec 28;18(Suppl 16):545. doi: 10.1186/s12859-017-1964-6. BMC Bioinformatics. 2017. PMID: 29297303 Free PMC article.
References
-
- Monti S, Tamayo P, Mesirov J, Golub T. Consensus Clustering: A Resampling-Based Method for Class Discovery and Visualization of Gene Expression Microarray Data. Mach Learn. 2003;52:91–118. doi: 10.1023/A:1023949509487. - DOI
-
- Jain AK. Data clustering: 50 years beyond K-means. Pattern Recogn Lett. 2010;31(8):651–666. doi: 10.1016/j.patrec.2009.09.011. - DOI
-
- Duda RO, Hart PE, Stork DG. Pattern Classification. 2nd ed: Wiley-Interscience; 2000.
MeSH terms
LinkOut - more resources
Full Text Sources
Other Literature Sources
Research Materials
Miscellaneous
