. 2016 Aug 24:7:12595.
doi: 10.1038/ncomms12595.

Stratification and therapeutic potential of PML in metastatic breast cancer

Affiliations

Stratification and therapeutic potential of PML in metastatic breast cancer

Natalia Martín-Martín et al. Nat Commun. .

Abstract

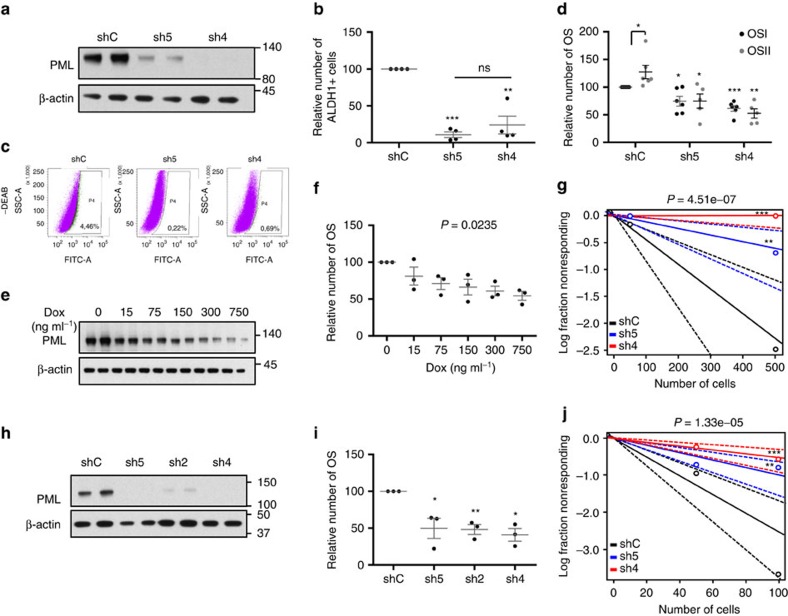
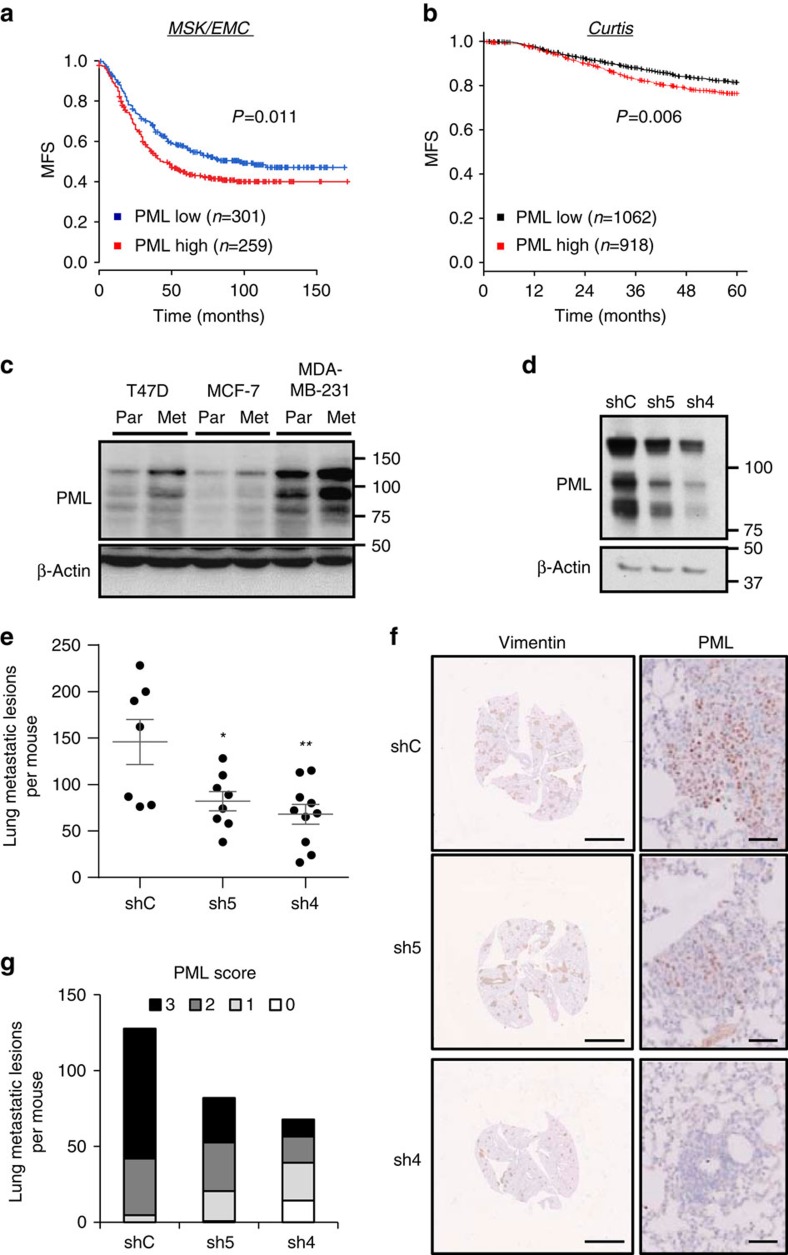
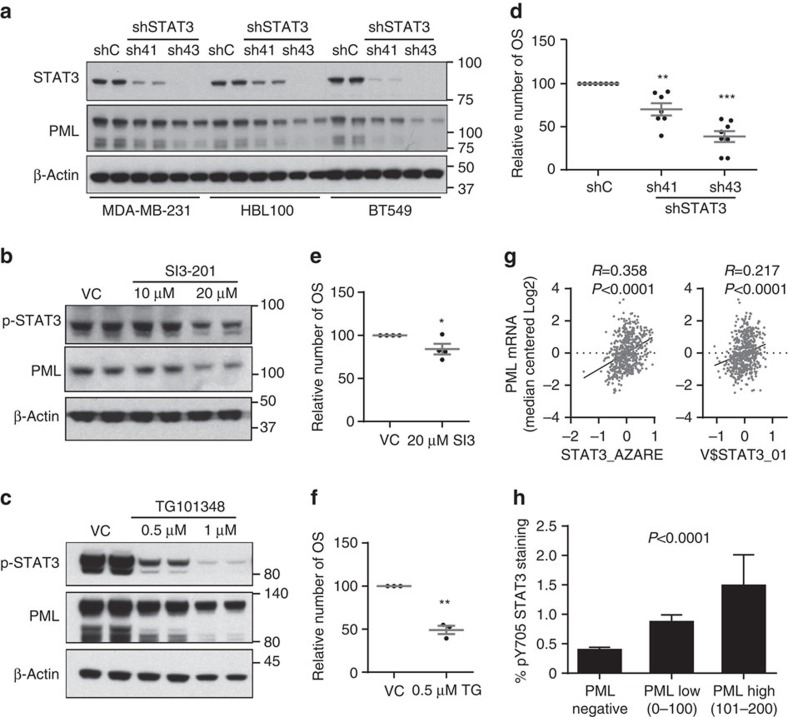
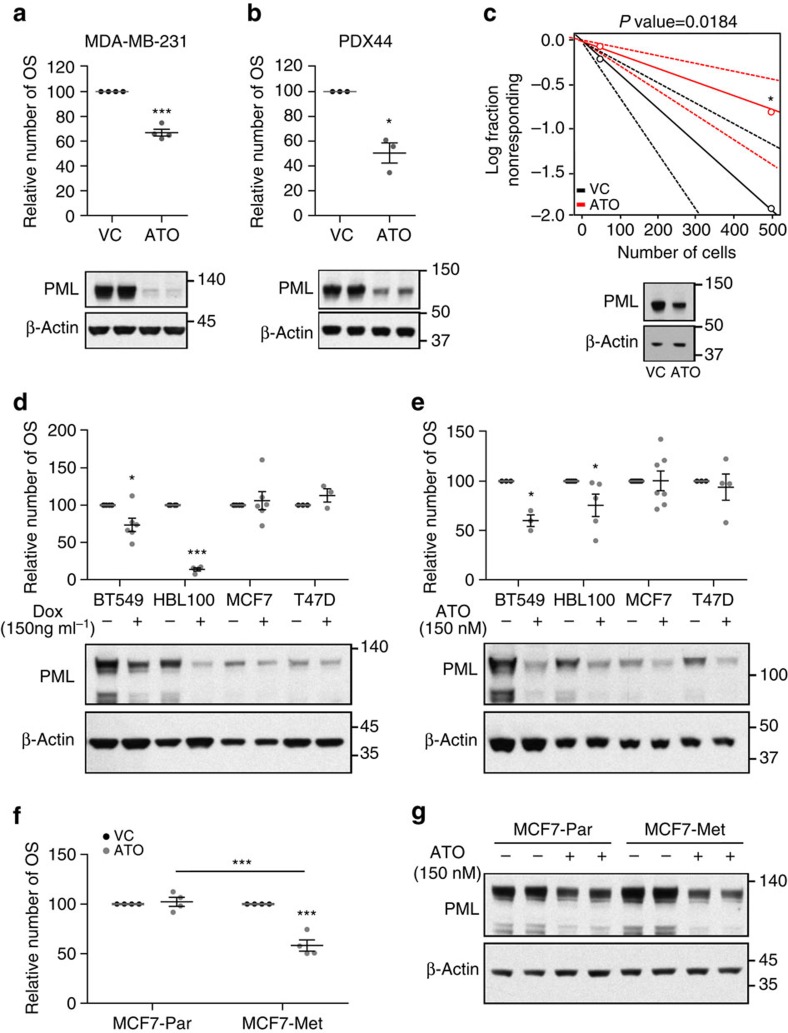
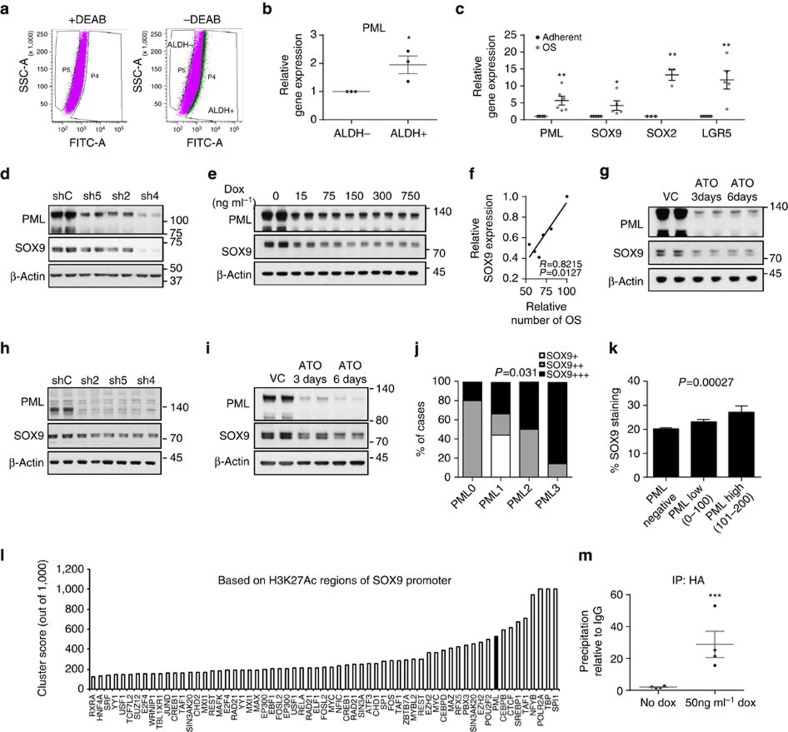
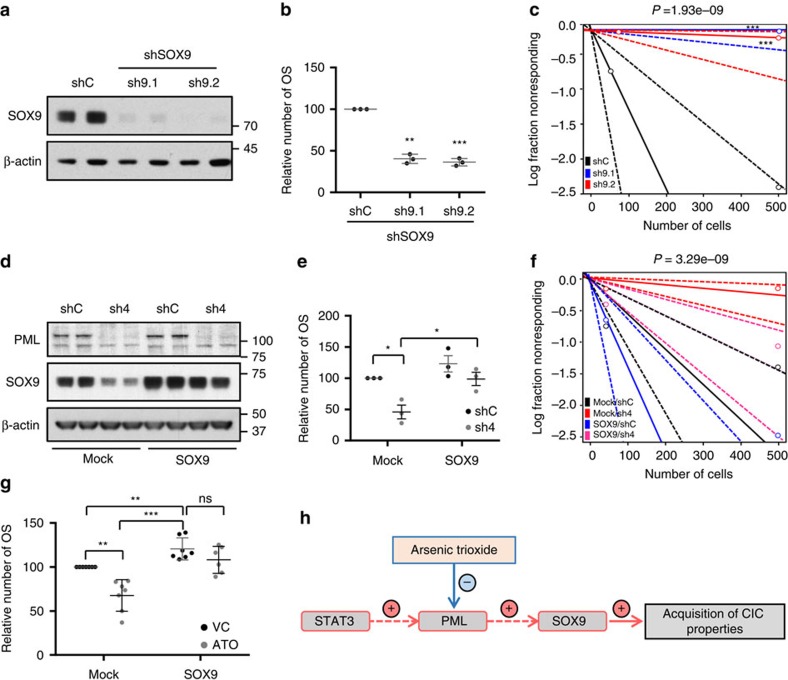
Patient stratification has been instrumental for the success of targeted therapies in breast cancer. However, the molecular basis of metastatic breast cancer and its therapeutic vulnerabilities remain poorly understood. Here we show that PML is a novel target in aggressive breast cancer. The acquisition of aggressiveness and metastatic features in breast tumours is accompanied by the elevated PML expression and enhanced sensitivity to its inhibition. Interestingly, we find that STAT3 is responsible, at least in part, for the transcriptional upregulation of PML in breast cancer. Moreover, PML targeting hampers breast cancer initiation and metastatic seeding. Mechanistically, this biological activity relies on the regulation of the stem cell gene SOX9 through interaction of PML with its promoter region. Altogether, we identify a novel pathway sustaining breast cancer aggressiveness that can be therapeutically exploited in combination with PML-based stratification.


Figures

Figure 1
Figure 1. Genetic targeting of PML hampers breast cancer initiation potential.
(a) PML levels (representative western blot out of four independent experiments) upon PML silencing with two shRNAs (sh) in MDA-MB-231 cells. (b) Percentage of ALDH1+ cells upon PML silencing with two shRNAs in MDA-MB-231 cells (n=4). (c) Representative flow cytometry analysis out of three independent experiments of the ALDH1+ population in shC or shPML-transduced MDA-MB-231 cells (FITC: fluorescein-isothiocyanate, SSC-A: side-scatter). (d) Effect of PML silencing on primary (OSI) and secondary (OSII) OS formation in MDA-MB-231 cells (n=5 for OSII in shPML cells and n=6 for shC and OSI in shPML cells). (e,f) PML levels (representative western blot out of three independent experiments) (e) and OS formation (n=3) (f) upon PML inducible silencing (shPML#4) with the indicated doses of doxycycline in MDA-MB-231 cells. (g) Limiting dilution experiment after xenotransplantation. Nude mice were inoculated with 500,000 or 50,000 MDA-MB-231 cells (n=12 injections per experimental condition). Tumour-initiating cell number was calculated using the ELDA platform. A log-fraction plot of the limiting dilution model fitted to the data is presented. The slope of the line is the log-active cell fraction (solid lines: mean; dotted lines: 95% confidence interval; circles: values obtained in each cell dilution). (h) PML levels (representative western blot out of four independent experiments) upon PML silencing in the PDX44-derived cell line. (i) OSI formation upon PML silencing in PDX44 cells (n=3). (j) Limiting dilution experiment after xenotransplantation. Nude mice were inoculated either with 100,000 or 10,000 PDX44 cells (n=20 injections per experimental condition). Tumour-initiating cell number was calculated using the ELDA platform as in g. Error bars represent s.e.m., P value (*P<0.05; **P<0.01; ***P<0.001 compared with shC or as indicated). Statistics test: one-tail unpaired t-test (b,d,i), analysis of variance (f) and χ2-test (g,j). dox, doxycycline; OS, oncospheres; shC, Scramble shRNA; sh2, sh4 and sh5, shRNA against PML.
Figure 2
Figure 2. PML is associated to breast cancer metastatic dissemination.
(a,b) Kaplan–Meier representations of MFS based on PML RNA expression. (a) MSK/EMC data set, n=560. (b) Curtis data set (MFS before 60 months), n=1980. PML high: above the mean expression; PML low: below the mean expression. (c) Representative western blot out of three independent experiments, showing PML protein expression in cell line sub-clones selected for high metastatic potential (Par=parental and Met=metastatic). (d–g) Effect of PML silencing on metastatic capacity of intravenously injected metastatic MDA-MB-231 sub-clones (n=10 mice per condition): Western blot showing PML silencing in cells at the time of injection (d), number of metastatic lesions (e), representative immunostaining of Vimentin (scale bar, 3 mm) and PML (scale bar, 50μm) as indicator of metastatic lesions (f), and number of metastatic lesions for each PML immunoreactivity score (22 metastatic foci were scored and extrapolated to the number of total metastatic foci in each lung) (g). Error bars represent s.e.m., P value (*P<0.05; **P<0.01 compared with shC). Statistical test: Gehan–Breslow–Wilcoxon test (a,b) and one-tail unpaired t-test (e). MFS, metastasis-free survival; shC: Scramble shRNA; sh4 and sh5, shRNA against PML.
Figure 3
Figure 3. STAT3 regulates PML expression in breast cancer.
(a) Representative western blot out of three independent experiments showing STAT3 and PML protein expression upon STAT3 silencing with two different shRNA (sh41 and sh43). (b,c) Representative western blot out of three independent experiments, showing STAT3 and PML protein expression upon STAT3 inhibition using SI3-201 (b) and TG101314 (c) in MDA-MB-231 cells. (d–f) Effect of STAT3 inhibition on primary OS formation using sh41 and sh43 against STAT3 (n=7) (d), SI3-201 (SI3; n=4) (e) and TG101314 (TG; n=3) (f) in MDA-MB-231 cells. (g) Correlation of two different STAT3 gene signatures with PML gene expression in the MSK/EMC data set. (h) Immunoreactivity of pY705 STAT3 protein in patient biopsies with varying expression of PML in the Marseille cohort (n=737). Error bars represent s.e.m., P value (*P<0.05; **P<0.01; ***P<0.001 compared with shC or VC as indicated). Statistics test: one-tail unpaired t-test (d,e,f), Pearson correlation (g) and analysis of variance (h). OSI, primary oncospheres; shC, Scramble shRNA; sh41 and sh43, shRNA against STAT3; VC, vehicle control.
Figure 4
Figure 4. PML inhibition selectively targets PML-high-expressing breast cancer cells.
(a,b) Effect of 150 nM ATO treatment on OSI formation (top panels) in MDA-MB-231 (n=4) (a) and PDX44 cells (n=3) (b) and PML protein expression (3-day treatment, lower panels, representative western blot out of four—MDA-MB-231—or three—PDX44—independent experiments). (c) Limiting dilution experiment after xenotransplantation. Nude mice were inoculated with 500,000 or 50,000 MDA-MB-231 cells (n=20 injections per experimental condition). ATO cells were pre-treated with 150 nM ATO 2 days before injection. Tumour-initiating cell number was calculated using the ELDA platform. A log-fraction plot of the limiting dilution model fitted to the data is presented. The slope of the line is the log-active cell fraction (solid lines: mean; dotted lines: 95% confidence interval; circles: values obtained in each cell dilution). A PML western blot from cells at the time of injection is presented in lower panel. (d,e) OSI formation in cell lines with high (BT549 and HBL100) and low (MCF7 and T47D) PML expression upon PML genetic silencing (MCF7 and T47D n=3, and BT549 and HBL100 n=6) (d) and 150 nM ATO (BT549 n=3, HBL100 n=5, MCF7 n=7 and T47D n=4) (e). A representative PML western blot out of three independent experiments is presented in lower panels. (f,g) Effect of 150 nM ATO on OSI formation (n=4) (f) and on PML levels (a representative western blot is presented out of four independent experiments) (g) in MCF7 parental cells and MCF7 metastatic sub-clone. Error bars represent s.e.m., P value (*P<0.05; ***P<0.001 compared with each control). Statistics test: one-tail unpaired t-test (a,b,d,e,f), χ2-test (c). ATO, arsenic trioxide; Met, metastatic; OSI, primary oncospheres; Par, parental; VC, vehicle control.
Figure 5
Figure 5. PML regulates SOX9 expression in breast cancer.
(a) Flow cytometry analysis of MDA-MB-231 cells based on ALDH1 activity. (b) PML gene expression in the two populations sorted in a (n=3). (c) Expression of self-renewal-associated genes in OSI compared with adherent MDA-MB-231 cells (PML n=6, SOX9 and LGR5 n=5 and SOX2 n=3). (d,e) Representative western blot out of four independent experiments depicting the downregulation of SOX9 protein upon constitutive (d) and inducible (e) PML silencing in MDA-MB-231 cells. (f) Correlation analysis of SOX9 protein densitometry from (e) and OSI formation in MDA-MB-231 cells (n=3). (g) Representative western blot out of four independent experiments depicting the downregulation of SOX9 protein upon 150 nM ATO treatment in MDA-MB-231 cells. (h,i) Representative western blot out of three independent experiments depicting the downregulation of SOX9 protein upon PML silencing (h) and 150 nM ATO treatment (i) in PDX44 cells. (j) PML and SOX9 immunoreactivity assed by immunohistochemistry in a panel of PDX samples (Table 1). (k) SOX9 immunoreactivity in patient biopsies with varying expression of PML in the Marseille cohort (n=737). (l) Cluster score of DNA-binding proteins in SOX9 promoter region using ENCODE database. (m) SOX9 promoter region abundance in chromatin immunoprecipitation (ChIP) of exogenous HA-PMLIV using HA-tag antibody in MDA-MB-231 cells after induction with 50 ng ml−1 doxycycline for 3 days (n=4). Data were normalized to IgG (negative-binding control). Error bars represent s.e.m., P value (*P<0.05, **P<0.01, ***P<0.001 compared with control). Statistic test: one-tail unpaired t-test (b,c,m), Pearson correlation (f), χ2-test (j) and analysis of variance (k). ATO, arsenic trioxide; DEAB, diethylaminobenzaldehyde; dox, doxycycline; OSI, primary oncospheres; shC, Scramble shRNA; sh2, sh4 and sh5, shRNA against PML; VC, vehicle control.
Figure 6
Figure 6. SOX9 is critical for the regulation of breast cancer-initiating capacity downstream PML.
(a,b) Effect of SOX9 silencing with two shRNA (sh9.1 and sh9.2) on SOX9 protein expression (representative western blot out of three independent experiments) (a) and on OSI formation (n=3) (b) in MDA-MB-231 cells. (c) Limiting dilution experiment after xenotransplantation. Nude mice were inoculated with 500,000 or 50,000 MDA-MB-231 cells (n=8 injections per experimental condition). Tumour-initiating cell number was calculated using the ELDA platform. A log-fraction plot of the limiting dilution model fitted to the data is presented. The slope of the line is the log-active cell fraction (solid lines: mean; dotted lines: 95% confidence interval; circles: values obtained in each cell dilution). (d,e) Effect of ectopic SOX9 expression on the consequences of PML silencing. Representative western blot (out of three independent experiments) depicting expression of PML and SOX9 (endogenous and ectopic protein are detected) (d) and OSI formation (n=3) (e) in the different experimental conditions in MDA-MB-231 cells. (f) Limiting dilution experiment to assess frequency of tumour-initiating cells after xenotransplantation. Nude mice were inoculated either with 500,000 or 50,000 MDA-MB-231 cells (n=12 per experimental condition, except in shC/Mock and sh4/SOX9, n=16). Tumour-initiating cell number was calculated using the ELDA platform as in c. (g) OSI formation in MDA-MB-231 cells transduced with the indicated constructs (mock, SOX9) and treated with vehicle or 150 nM ATO (n=6). (h) Diagram of the molecular mechanism by which PML controls the expression of the stem cell factor SOX9 to regulate BCa-initiating cell function. Error bars represent s.e.m., P value (*P<0.05; **P<0.01; ***P<0.001 compared with its control or as indicated). Statistic test: one-tail unpaired t-test (b,e,g) and χ2-test (c,f). ATO, arsenic trioxide; OSI, primary oncospheres; shC, Scramble shRNA; sh9.1 and sh9.2, shRNA against SOX9; sh4, shRNA against PML; VC, vehicle control.

References

    1. Haber D. A., Gray N. S. & Baselga J. The evolving war on cancer. Cell 145, 19–24 (2011). - PubMed
    1. Sorlie T. et al.. Gene expression patterns of breast carcinomas distinguish tumor subclasses with clinical implications. Proc. Natl Acad. Sci. USA 98, 10869–10874 (2001). - PMC - PubMed
    1. Curtis C. et al.. The genomic and transcriptomic architecture of 2,000 breast tumours reveals novel subgroups. Nature 486, 346–352 (2012). - PMC - PubMed
    1. Normanno N. et al.. Prognostic applications of gene expression signatures in breast cancer. Oncology (Williston Park) 77, (Suppl 1): 2–8 (2009). - PubMed
    1. van de Vijver M. J. et al.. A gene-expression signature as a predictor of survival in breast cancer. N. Engl. J. Med. 347, 1999–2009 (2002). - PubMed

Publication types

MeSH terms