. 2016 Nov 3;128(18):2206-2217.
doi: 10.1182/blood-2016-04-711580. Epub 2016 Aug 23.

In vivo transduction of primitive mobilized hematopoietic stem cells after intravenous injection of integrating adenovirus vectors

Affiliations

In vivo transduction of primitive mobilized hematopoietic stem cells after intravenous injection of integrating adenovirus vectors

Maximilian Richter et al. Blood. .

Erratum in

Abstract

Current protocols for hematopoietic stem/progenitor cell (HSPC) gene therapy, involving the transplantation of ex vivo genetically modified HSPCs are complex and not without risk for the patient. We developed a new approach for in vivo HSPC transduction that does not require myeloablation and transplantation. It involves subcutaneous injections of granulocyte-colony-stimulating factor/AMD3100 to mobilize HSPCs from the bone marrow (BM) into the peripheral blood stream and the IV injection of an integrating, helper-dependent adenovirus (HD-Ad5/35++) vector system. These vectors target CD46, a receptor that is uniformly expressed on HSPCs. We demonstrated in human CD46 transgenic mice and immunodeficient mice with engrafted human CD34+ cells that HSPCs transduced in the periphery home back to the BM where they stably express the transgene. In hCD46 transgenic mice, we showed that our in vivo HSPC transduction approach allows for the stable transduction of primitive HSPCs. Twenty weeks after in vivo transduction, green fluorescent protein (GFP) marking in BM HSPCs (Lin-Sca1+Kit- cells) in most of the mice was in the range of 5% to 10%. The percentage of GFP-expressing primitive HSPCs capable of forming multilineage progenitor colonies (colony-forming units [CFUs]) increased from 4% of all CFUs at week 4 to 16% at week 12, indicating transduction and expansion of long-term surviving HSPCs. Our approach was well tolerated, did not result in significant transduction of nonhematopoietic tissues, and was not associated with genotoxicty. The ability to stably genetically modify HSPCs without the need of myeloablative conditioning is relevant for a broader clinical application of gene therapy.


Conflict of interest statement

Conflict-of-interest disclosure: The authors declare no competing financial interests.

Figures
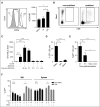
Figure 1
Figure 1
In vivo transduction of mobilized HSPCs with a first-generation Ad5/35++ vector after mobilization. (A) hCD46 expression on BM total MNCs, lineage-depleted BM cells (Lin), and LSK cells from hCD46tg mice. Representative hCD46 flow cytometry analysis with MNC (solid black) and LSK cells (dashed black) (left). The gray curve represents MNCs stained with an isotype-matched control. hCD46 MFI on MNCs, Lin, and LSK cells (right). N = 3. *P < .05, after one-way analysis of variance (ANOVA) with Tukey’s multiple comparison test. (B) Mobilization of LSK cells in hCD46tg mice by SC G-CSF injection for 4 days, followed by a single SC injection of AMD3100 on day 5. Forty minutes after the AMD3100 injection, PBMCs were harvested and analyzed by flow cytometry for LSK cells. Representative plots of nonmobilized and mobilized mice are shown. (C) Analysis of HSPC mobilization based on CFU formation. PBMCs were collected before onset of mobilization treatment, before injection of AMD3100, 40 minutes and 3 hours after the AMD3100 injection, as well as on days 3, 7, and 14 after mobilization. The collected cells were subjected to CFU assays and colonies were enumerated 12 days after plating. Shown are mean ± standard deviation (SD), colonies normalized to a blood volume of 100 μL. N = 3. (D) A total of 4 × 10¹⁰ vp of the first-generation Ad5/35++-GFP vector was IV injected 40 minutes after AMD3100. To alleviate release of pro-inflammatory cytokines associated with IV Ad vector injection, animals received dexamethasone (10 mg/kg) IP 16 hours and 2 hours before virus injection. Early transduction was analyzed by harvesting PBMCs, BM, and spleen cells at 2 hours after virus injection, and culturing them for 48 hours to allow for GFP expression. Shown is the percentage of GFP+ cells in the LSK cell fractions (analyzed by flow cytometry). N = 3. (E) Animals were mobilized and injected with Ad5/35++-GFP as before. Animals were euthanized and PBMCs collected at 2 hours and 6 hours after transduction. The cells were cultured for 48 hours to allow for GFP expression. Shown is the percentage of GFP+ LSK cells. In addition, GFP expression in peripheral blood LSK cells was analyzed at 3 days after transduction, without culturing of the cells. Unmobilized, untransduced animals were used as controls (mock). N = 3. (F) Animals were mobilized and injected with Ad5/35++-GFP as before. Transduction was analyzed by harvesting BM and splenic cells at day 3, 7, and 14 after Ad5/35++-GFP injection. Nonmobilized control animals were euthanized 2 days after infection. Shown is the percentage of GFP+ cells within total MNCs, and LSK cells in the BM and spleen. N = 3. Values represent means ± SD. *P < .05; **P < .01; ***P < .001; ****P < .0001, after unpaired Student t test comparing nonmobilized controls with animals euthanized 3 days after transduction. dpi, days postinfusion; Iso, isolated; MFI, mean fluorescence intensity; Mobil, mobilized; n.s., not significant.
Figure 2
Figure 2
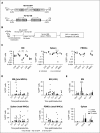
Stable in vivo HSPC transduction with integrating HD-Ad5/35++ vectors. (A) Vector genome structure. The transposon vector (HD-Ad–GFP (left) carries an Ef1α-driven GFP expression cassette that is flanked by inverted transposon repeats and frt sites. The second vector (HD-Ad–SB) (right) provides both Flpe recombinase and SB100× transposase in trans. Both are HD vectors containing the affinity-enhanced Ad35++ fiber knob. (B) Experimental design of the study demonstrating in vivo HSPC transduction with HD-Ad vectors. hCD46tg mice were mobilized and IV injected with HD-Ad–GFP (2 injections, each 2 × 10¹⁰ vp) or a 1:1 mixture of HD-Ad–GFP plus HD-Ad–SB (2 injections, each 4 × 10¹⁰ vp). Groups of mice were euthanized at 3 days, 4, 8, 12, and 20 weeks after injection, and BM cells, splenocytes, and PBMCs were harvested. GFP expression in total MNCs (for BM, spleen, and PBMC) and BM LSK cells was analyzed by flow cytometry. (C) Mobilized and nonmobilized hCD46tg animals were injected with HD-Ad–SB + HD-Ad–GFP. BM cells (left), splenocytes (middle), and PBMCs (right) were collected 3 days after transduction, and expression of GFP in different lineages as well as LSK cells and total MNCs were analyzed via flow cytometry. N = 5. *P < .05 after two-way ANOVA with Bonferroni posttesting.**P < .01; ***P < .001; ****P < .0001. (D) GFP expression in total BM (upper left), spleen (lower left), and peripheral blood MNCs (lower right), as well as BM LSK cells (upper right). Circles represent animals injected with HD-Ad–GFP only (N = 6). Squares represent animals injected with HD-Ad–GFP + HD-Ad–SB euthanized at 3 days (N = 5), 4 (N = 10), 8 (N = 10), 12 (N = 11), and 20 weeks (N = 5) after transduction. Each data point represents a single animal. **P < .01. (E) GFP marking in hematopoietic lineages of BM and spleen. Animals were euthanized 3 days as well as 8 and 20 weeks after transduction, and GFP expression in different lineages was analyzed via flow cytometry. Shown is the mean ± SD percentage of GFP+ cells in the indicated lineages. ****P < .0001. Some of the data, eg, the decrease in GFP+/CD19+ cells and the increase in GFP+/Gr-1+ cells in the BM between weeks 8 and 20 cannot be readily explained. ITR, inverted terminal repeats; PGK, phosphoglycerate kinase.
Figure 3
Figure 3
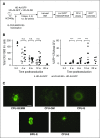
In vivo transduction of HSPCs with CFU potential. hCD46tg animals were mobilized and in vivo transduced with HD-Ad–GFP (n = 6 for 4 and 8 weeks, and n = 5 for 12 weeks after transduction) alone or with a combination of HD-Ad–GFP and HD-Ad–SB (n = 5 for 3 days, n = 10 for 4 weeks, n = 12 for 8 and 12 weeks, and n = 5 for 20 weeks post-transduction). Animals were euthanized 3 days, 4, 8, 12, or 20 weeks after transduction, BM cells were isolated, lineage depleted via MACS, and followed by the collection of GFP+ cells via fluorescence-activated cell sorting. Cells were then plated in CFU assays and colonies were scored 12 days after plating. (A) Experimental design. (B) Total colonies formed per 1000 plated Lin cells (left) and percentage of GFP+ colonies among total CFUs (right). Shown are single animals as well as group means. (Open circles, HD-Ad-GFP; filled squares, HD-Ad-SB + HD-Ad-GFP.) Two-way ANOVA with Bonferroni posttesting for multiple comparisons = n.s. ***P < .001. (C) GFP expression in progenitor colonies. Examples for GFP+ erythroid burst-forming units, CFUs of erythroid progenitors (erythroid CFU), granulocyte progenitors, granulocyte/macrophage progenitors, and multipotential progenitor cells (granulocyte, erythrocyte, monocyte, and megakaryocyte CFUs) are shown. The scale bar is 500 μm. No specific feature within images shown in panel C was enhanced, obscured, moved, removed, or introduced. BFU-E, erythroid burst-forming unit; CFU-E, erythroid CFU; CFU-G, granulocyte CFU; CFU-GEMM, granulocyte, erythrocyte, monocyte, and megakaryocyte CFU; CFU-GM, granulocyte/macrophage CFU; MACS, magnetic-activated cell sorting; n.s., not significant.
Figure 4
Figure 4
Gene-modified HSPCs are capable of long-term, multilineage reconstitution of lethally irradiated recipients. (A) Experimental design. BM harvested from hCD46tg mice 8 weeks after in vivo transduction with HD-Ad–GFP and HD-Ad–SB was sorted for GFP+ cells. A total of 1 × 10⁶ GFP+ cells per recipient (pooled from different mice) were transplanted into lethally irradiated C57BL/6 mice. PBMCs were collected 4, 6, 8, 10, 12, and 14 weeks after transplantation, and analyzed for hCD46 and GFP expression by flow cytometry. N = 7. (B) Engraftment rate of transplanted cells based on hCD46 flow cytometry of PBMCs. Shown are single animals (filled squares) and the mean. (C) Percentage of GFP+ PBMCs analyzed at the indicated time points. (D) Week 16 GFP marking in BM lineage-depleted cells and cell fractions enriched for HSPCs (LSK, SLAM [LSK/CD150+/CD48]). (E) Week 16 GFP marking in BM, PBMCs, and spleen lineage-committed cells (CD3, CD19, CD11b, and Gr-1). Shown are mean ± SD. One-way ANOVA with Bonferroni posttesting. (F) GFP expression in CD45+ cells of the lung and thymus. Shown are mean ± SD. n.s., not significant; SLAM, signaling lymphocyte activation molecules.
Figure 5
Figure 5
HD-Ad5/35 vector genome distribution and inflammatory reaction in hCD46tg mice. (A) HD-Ad–GFP (4 × 10¹⁰ vp) was IV injected into mobilized hCD46tg mice. Animals received dexamethasone (10 mg/kg) IP 16 hours and 2 hours before virus injection. Three days later, genomic DNA from tissue samples was analyzed for HD-Ad vector genomes using quantitative PCR with GFP-specific primers. Shown are vector copies per cell. N = 3. (B) Immunofluorescence analysis of liver sections at day 3 after vector injection into mobilized mice. Mice received either HD-Ad–GFP or first-generation Ad5-GFP at a dose of 4 × 10¹⁰ vp per animal. GFP appears in green, murine CD45 in red, and DAPI-stained nuclei in blue. The arrows in the middle panel indicate transduced blood cells present in a liver blood vessel. The scale bar is 50 μm. No specific feature within images shown in panel B was enhanced, obscured, moved, removed, or introduced. Previously, we and others have shown that Ad5 entry into hepatocytes is mediated by Ad5 hexon protein interaction with coagulation FX, and that this pathway is inefficient if Ad5 vectors contain the short Ad35 fibers (such as in the Ad5/35++ vectors used here), most likely due to a steric block of the FX-interacting domains within the Ad5 hexon. (C) Levels of serum alanine transaminase and aspartate transaminase at day 3 after Ad injection. N = 3. *P < .05, ****P < .0001 after one-way ANOVA with Bonferroni posttesting. (D) Serum levels of different cytokines, 6 hours after vector injection in mobilized animals. Animals had been mobilized as before and a total of 8 × 10¹⁰ vp HD-Ad–GFP was IV injected. Shown are mean ± SD. Dotted lines represent the detection limits of the different cytokines. Serum of unmobilized, uninjected animals was used as a control (untreated). N = 5. CTRL, control; FX, factor X; IFN, interferon; MCP, membrane cofactor protein; TNF, tumor necrosis factor.
Figure 6
Figure 6
Analysis of vector integration sites in HSPCs. Genomic DNA isolated from 20 pooled GFP+ progenitor colonies from BM cells of female hCD46tg animals, harvested 8 weeks after HD-Ad–GFP + HD-Ad–SB in vivo transduction and SB-mediated transgene integration sites were recovered. (A) Chromosomal distribution of integration sites in GFP+ CFU colonies. (B) Percentage of total integration events per chromosome. (C) Integration sites were mapped to the mouse genome, and their location with respect to genes was analyzed. Shown is the percentage of integration events that occurred outside of genes, within intronic regions, and within exons, respectively.
Figure 7
Figure 7
HSPC in vivo transduction in a humanized mouse model. (A) CD46 MFI on human CD34+ and CD34+/CD38 cells derived from umbilical cord blood MNCs. (B-D) In vivo studies in humanized mice. NOG mice received whole body irradiation and were transplanted with human CD34+ cells. Six weeks after transplantation, successful engraftment was confirmed by huCD45 flow cytometry of PBMCs. Animals were then mobilized and injected with HD-Ad–SB + HD-Ad–GFP. (B) Mobilization of human HSPCs. PBMCs were collected 90 minutes after AMD3100. PBMCs were plated in CFU assays in the presence of human or murine cytokines. Total CFU were enumerated 12 days after plating. N = 2. Differences between mobilized and nonmobilized animals were not statistically significant after unpaired Student t tests. (C) GFP expression in total human CD45+ cells and in HSPCs (CD34+ or c-Kit+ cells) in the BM, spleen, and PBMCs 3 days after HD-Ad–SB + HD-Ad–GFP injection into mobilized mice. N = 2. **P < .01 after one-way ANOVA with Bonferroni posttesting. (D) GFP expression in human (hCD45+) cells in the BM and spleen at day 3 (N = 4) and week 4 (N = 7) after in vivo transduction with HD-Ad–SB + HD-Ad–GFP. Values represent mean ± SD. ***P < .001 after one-way ANOVA with Bonferroni posttesting. (E-F) Lineage composition of hematopoietic tissues and transgene expression in hematopoietic lineages following HSPC in vivo transduction. Humanized NOG mice were mobilized and injected with HD-Ad–SB + HD-Ad–GFP as before. Animals were euthanized at 3 days (n = 2) or 4 weeks (n = 3) after transduction, and expression of GFP and lineage surface markers was assessed via flow cytometry. (E) Expression of hematopoietic lineage surface markers after HSPC in vivo transduction in the BM, spleen, and peripheral blood. An unmobilized, untreated, humanized NOG animal was used as control (mock). Shown are mean ± SD. (F) GFP expression in hematopoietic lineages at 3 days and 4 weeks after HSPC in vivo transduction. Shown are mean ± SD. *P < .05 following two-way ANOVA with Bonferroni posttesting. **P < .01; ***P < .001. iso, isolated; n.s., not significant; mobil, mobilized.

Comment in

  • Gene therapy simplified.
    Ren J, Stroncek DF. Ren J, et al. Blood. 2016 Nov 3;128(18):2194-2195. doi: 10.1182/blood-2016-09-736983. Blood. 2016. PMID: 27811188 Free PMC article.

References

    1. Naldini L. Gene therapy returns to centre stage. Nature. 2015;526(7573):351–360. - PubMed
    1. Bonig H, Papayannopoulou T. Mobilization of hematopoietic stem/progenitor cells: general principles and molecular mechanisms. Methods Mol Biol. 2012;904:1–14. - PMC - PubMed
    1. Fruehauf S, Veldwijk MR, Seeger T, et al. A combination of granulocyte-colony-stimulating factor (G-CSF) and plerixafor mobilizes more primitive peripheral blood progenitor cells than G-CSF alone: results of a European phase II study. Cytotherapy. 2009;11(8):992–1001. - PubMed
    1. Abkowitz JL, Catlin SN, McCallie MT, Guttorp P. Evidence that the number of hematopoietic stem cells per animal is conserved in mammals. Blood. 2002;100(7):2665–2667. - PubMed
    1. Li L, Krymskaya L, Wang J, et al. Genomic editing of the HIV-1 coreceptor CCR5 in adult hematopoietic stem and progenitor cells using zinc finger nucleases. Mol Ther. 2013;21(6):1259–1269. - PMC - PubMed

Publication types

Substances