

Identification of novel regulators of developmental hematopoiesis using Endoglin regulatory elements as molecular probes
- PMID: 27554085
- PMCID: PMC5064716
- DOI: 10.1182/blood-2016-02-697870
Identification of novel regulators of developmental hematopoiesis using Endoglin regulatory elements as molecular probes
Erratum in
-
Nasrallah R, Fast EM, Solaimani P, et al. Identification of novel regulators of developmental hematopoiesis using Endoglin regulatory elements as molecular probes. Blood. 2016;128(15):1928-1939.Blood. 2017 Nov 16;130(20):2234. doi: 10.1182/blood-2017-10-809830. Blood. 2017. PMID: 29146822 Free PMC article. No abstract available.
Abstract
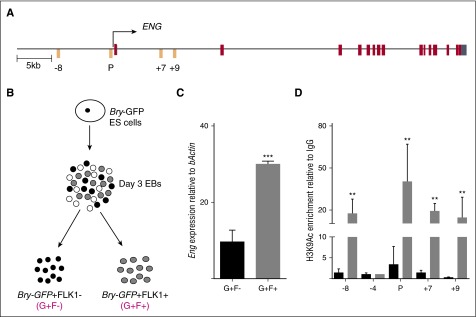
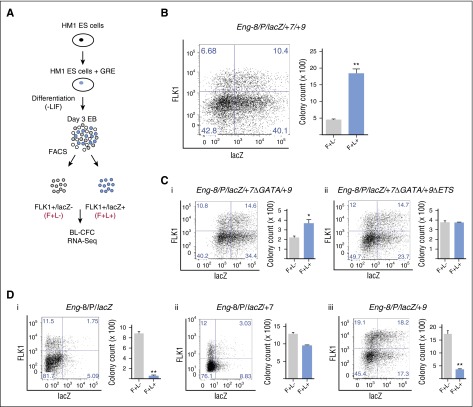
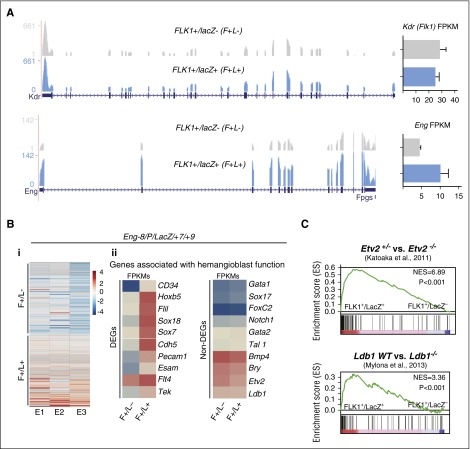
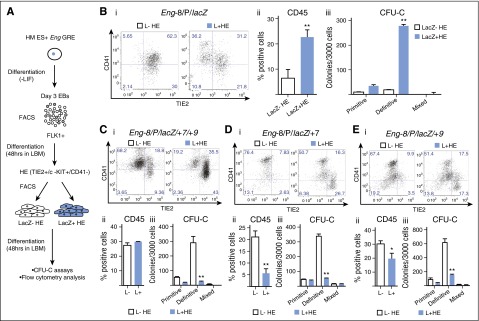
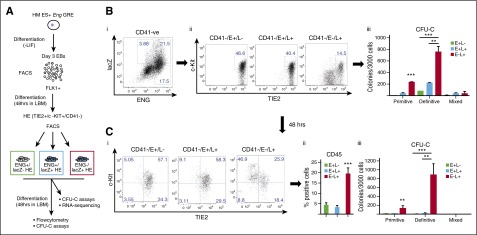
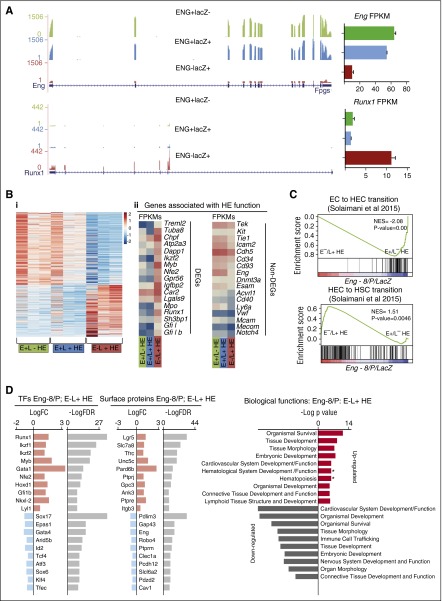
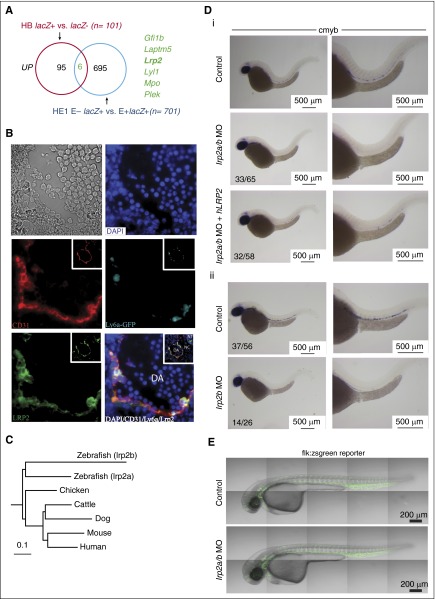
Enhancers are the primary determinants of cell identity, and specific promoter/enhancer combinations of Endoglin (ENG) have been shown to target blood and endothelium in the embryo. Here, we generated a series of embryonic stem cell lines, each targeted with reporter constructs driven by specific promoter/enhancer combinations of ENG, to evaluate their discriminative potential and value as molecular probes of the corresponding transcriptome. The Eng promoter (P) in combination with the -8/+7/+9-kb enhancers, targeted cells in FLK1 mesoderm that were enriched for blast colony forming potential, whereas the P/-8-kb enhancer targeted TIE2+/c-KIT+/CD41- endothelial cells that were enriched for hematopoietic potential. These fractions were isolated using reporter expression and their transcriptomes profiled by RNA-seq. There was high concordance between our signatures and those from embryos with defects at corresponding stages of hematopoiesis. Of the 6 genes that were upregulated in both hemogenic mesoderm and hemogenic endothelial fractions targeted by the reporters, LRP2, a multiligand receptor, was the only gene that had not previously been associated with hematopoiesis. We show that LRP2 is indeed involved in definitive hematopoiesis and by doing so validate the use of reporter gene-coupled enhancers as probes to gain insights into transcriptional changes that facilitate cell fate transitions.
© 2016 by The American Society of Hematology.
Figures
Similar articles
-
Endoglin potentiates nitric oxide synthesis to enhance definitive hematopoiesis.Biol Open. 2015 May 15;4(7):819-29. doi: 10.1242/bio.011494. Biol Open. 2015. PMID: 25979706 Free PMC article.
-
A critical role for endoglin in the emergence of blood during embryonic development.Blood. 2012 Jun 7;119(23):5417-28. doi: 10.1182/blood-2011-11-391896. Epub 2012 Apr 24. Blood. 2012. PMID: 22535663 Free PMC article.
-
CXCR4 Signaling Negatively Modulates the Bipotential State of Hemogenic Endothelial Cells Derived from Embryonic Stem Cells by Attenuating the Endothelial Potential.Stem Cells. 2016 Dec;34(12):2814-2824. doi: 10.1002/stem.2441. Epub 2016 Jul 4. Stem Cells. 2016. PMID: 27340788
-
Hemangioblast, hemogenic endothelium, and primitive versus definitive hematopoiesis.Exp Hematol. 2017 May;49:19-24. doi: 10.1016/j.exphem.2016.12.009. Epub 2016 Dec 30. Exp Hematol. 2017. PMID: 28043822 Review.
-
Dorso-ventral contributions in the formation of the embryonic aorta and the control of aortic hematopoiesis.Blood Cells Mol Dis. 2013 Dec;51(4):232-8. doi: 10.1016/j.bcmd.2013.07.004. Epub 2013 Aug 7. Blood Cells Mol Dis. 2013. PMID: 23932235 Review.
Cited by
-
Genome-wide transcription factor-binding maps reveal cell-specific changes in the regulatory architecture of human HSPCs.Blood. 2023 Oct 26;142(17):1448-1462. doi: 10.1182/blood.2023021120. Blood. 2023. PMID: 37595278 Free PMC article.
-
Is LRP2 Involved in Leptin Transport over the Blood-Brain Barrier and Development of Obesity?Int J Mol Sci. 2021 May 8;22(9):4998. doi: 10.3390/ijms22094998. Int J Mol Sci. 2021. PMID: 34066779 Free PMC article.
-
Identification of Novel Hemangioblast Genes in the Early Chick Embryo.Cells. 2018 Jan 31;7(2):9. doi: 10.3390/cells7020009. Cells. 2018. PMID: 29385069 Free PMC article.
-
In vivo clonal tracking reveals evidence of haemangioblast and haematomesoblast contribution to yolk sac haematopoiesis.Nat Commun. 2023 Jan 3;14(1):41. doi: 10.1038/s41467-022-35744-x. Nat Commun. 2023. PMID: 36596806 Free PMC article.
-
A Single Trophoblast Layer Acts as the Gatekeeper at the Endothelial-Hematopoietic Crossroad in the Placenta.bioRxiv [Preprint]. 2024 Jul 16:2024.07.12.603303. doi: 10.1101/2024.07.12.603303. bioRxiv. 2024. PMID: 39071312 Free PMC article. Preprint.
References
-
- Kiel MJ, Yilmaz OH, Iwashita T, Yilmaz OH, Terhorst C, Morrison SJ. SLAM family receptors distinguish hematopoietic stem and progenitor cells and reveal endothelial niches for stem cells. Cell. 2005;121(7):1109–1121. - PubMed
-
- Notta F, Doulatov S, Laurenti E, Poeppl A, Jurisica I, Dick JE. Isolation of single human hematopoietic stem cells capable of long-term multilineage engraftment. Science. 2011;333(6039):218–221. - PubMed
-
- Medvinsky A, Rybtsov S, Taoudi S. Embryonic origin of the adult hematopoietic system: advances and questions. Development. 2011;138(6):1017–1031. - PubMed
Publication types
MeSH terms
Substances
Grants and funding
- 12487/CRUK_/Cancer Research UK/United Kingdom
- BBS/E/B/000C0409/BB_/Biotechnology and Biological Sciences Research Council/United Kingdom
- 19565/CRUK_/Cancer Research UK/United Kingdom
- P30 DK049216/DK/NIDDK NIH HHS/United States
- 12765/CRUK_/Cancer Research UK/United Kingdom
- P01 HL032262/HL/NHLBI NIH HHS/United States
- BB/I001794/1/BB_/Biotechnology and Biological Sciences Research Council/United Kingdom
- R01 HL048801/HL/NHLBI NIH HHS/United States
- BB/N007794/1/BB_/Biotechnology and Biological Sciences Research Council/United Kingdom
- BBS/E/B/000C0407/BB_/Biotechnology and Biological Sciences Research Council/United Kingdom
- WT_/Wellcome Trust/United Kingdom
- MC_PC_12009/MRC_/Medical Research Council/United Kingdom
- U54 DK110805/DK/NIDDK NIH HHS/United States
- R24 DK092760/DK/NIDDK NIH HHS/United States
- R01 DK053298/DK/NIDDK NIH HHS/United States
- 12486/CRUK_/Cancer Research UK/United Kingdom
LinkOut - more resources
Full Text Sources
Other Literature Sources
Molecular Biology Databases
Research Materials
Miscellaneous
