Deficiency in the Heat Stress Response Could Underlie Susceptibility to Metabolic Disease
- PMID: 27554472
- PMCID: PMC5079638
- DOI: 10.2337/db16-0292
Deficiency in the Heat Stress Response Could Underlie Susceptibility to Metabolic Disease
Abstract
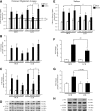
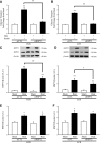
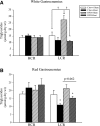
Heat treatment (HT) effectively prevents insulin resistance and glucose intolerance in rats fed a high-fat diet (HFD). The positive metabolic actions of heat shock protein 72 (HSP72), which include increased oxidative capacity and enhanced mitochondrial function, underlie the protective effects of HT. The purpose of this study was to test the ability of HSP72 induction to mitigate the effects of consumption of a short-term 3-day HFD in rats selectively bred to be low-capacity runners (LCRs) and high-capacity runners (HCRs)-selective breeding that results in disparate differences in intrinsic aerobic capacity. HCR and LCR rats were fed a chow or HFD for 3 days and received a single in vivo HT (41°C, for 20 min) or sham treatment (ST). Blood, skeletal muscles, liver, and adipose tissues were harvested 24 h after HT/ST. HT decreased blood glucose levels, adipocyte size, and triglyceride accumulation in liver and muscle and restored insulin sensitivity in glycolytic muscles from LCR rats. As expected, HCR rats were protected from the HFD. Importantly, HSP72 induction was decreased in LCR rats after only 3 days of eating the HFD. Deficiency in the highly conserved stress response mediated by HSPs could underlie susceptibility to metabolic disease with low aerobic capacity.
© 2016 by the American Diabetes Association.
Figures


Similar articles
-
Ovariectomized Highly Fit Rats Are Protected against Diet-Induced Insulin Resistance.Med Sci Sports Exerc. 2016 Jul;48(7):1259-69. doi: 10.1249/MSS.0000000000000898. Med Sci Sports Exerc. 2016. PMID: 26885638 Free PMC article.
-
Female rats selectively bred for high intrinsic aerobic fitness are protected from ovariectomy-associated metabolic dysfunction.Am J Physiol Regul Integr Comp Physiol. 2015 Mar 15;308(6):R530-42. doi: 10.1152/ajpregu.00401.2014. Epub 2015 Jan 21. Am J Physiol Regul Integr Comp Physiol. 2015. PMID: 25608751 Free PMC article.
-
Artificial selection for high-capacity endurance running is protective against high-fat diet-induced insulin resistance.Am J Physiol Endocrinol Metab. 2007 Jul;293(1):E31-41. doi: 10.1152/ajpendo.00500.2006. Epub 2007 Mar 6. Am J Physiol Endocrinol Metab. 2007. PMID: 17341547
-
Intrinsic High Aerobic Capacity in Male Rats Protects Against Diet-Induced Insulin Resistance.Endocrinology. 2019 May 1;160(5):1179-1192. doi: 10.1210/en.2019-00118. Endocrinology. 2019. PMID: 31144719 Free PMC article.
-
Theoretical and Biological Evaluation of the Link between Low Exercise Capacity and Disease Risk.Cold Spring Harb Perspect Med. 2018 Jan 2;8(1):a029868. doi: 10.1101/cshperspect.a029868. Cold Spring Harb Perspect Med. 2018. PMID: 28389512 Free PMC article. Review.
Cited by
-
Recent advances in understanding glucose transport and glucose disposal.F1000Res. 2020 Jun 24;9:F1000 Faculty Rev-639. doi: 10.12688/f1000research.22237.1. eCollection 2020. F1000Res. 2020. PMID: 32595948 Free PMC article. Review.
-
Exposome-wide Association Study for Metabolic Syndrome.Front Genet. 2021 Dec 7;12:783930. doi: 10.3389/fgene.2021.783930. eCollection 2021. Front Genet. 2021. PMID: 34950191 Free PMC article. No abstract available.
-
Exercise, heat shock proteins and insulin resistance.Philos Trans R Soc Lond B Biol Sci. 2018 Jan 19;373(1738):20160529. doi: 10.1098/rstb.2016.0529. Philos Trans R Soc Lond B Biol Sci. 2018. PMID: 29203714 Free PMC article. Review.
-
Endothelial HSP72 is not reduced in type 2 diabetes nor is it a key determinant of endothelial insulin sensitivity.Am J Physiol Regul Integr Comp Physiol. 2022 Jul 1;323(1):R43-R58. doi: 10.1152/ajpregu.00006.2022. Epub 2022 Apr 26. Am J Physiol Regul Integr Comp Physiol. 2022. PMID: 35470695 Free PMC article.
-
Localized Heat Therapy Improves Mitochondrial Respiratory Capacity but Not Fatty Acid Oxidation.Int J Mol Sci. 2022 Jul 31;23(15):8500. doi: 10.3390/ijms23158500. Int J Mol Sci. 2022. PMID: 35955635 Free PMC article.
References
-
- Myers J, Prakash M, Froelicher V, Do D, Partington S, Atwood JE. Exercise capacity and mortality among men referred for exercise testing. N Engl J Med 2002;346:793–801 - PubMed
-
- Kodama S, Saito K, Tanaka S, et al. . Cardiorespiratory fitness as a quantitative predictor of all-cause mortality and cardiovascular events in healthy men and women: a meta-analysis. JAMA 2009;301:2024–2035 - PubMed
-
- Kokkinos P, Myers J, Faselis C, et al. . Exercise capacity and mortality in older men: a 20-year follow-up study. Circulation 2010;122:790–797 - PubMed
-
- Church TS, Cheng YJ, Earnest CP, et al. . Exercise capacity and body composition as predictors of mortality among men with diabetes. Diabetes Care 2004;27:83–88 - PubMed
-
- LaMonte MJ, Barlow CE, Jurca R, Kampert JB, Church TS, Blair SN. Cardiorespiratory fitness is inversely associated with the incidence of metabolic syndrome: a prospective study of men and women. Circulation 2005;112:505–512 - PubMed
MeSH terms
Substances
Grants and funding
LinkOut - more resources
Full Text Sources
Other Literature Sources
Medical
Research Materials

