

Published Erratum
doi: 10.1016/j.ebiom.2016.08.003.
Epub 2016 Aug 4.
Corrigendum to "One of the Immune Activation Profiles Observed in HIV-1-Infected Adults with Suppressed Viremia is Linked to Metabolic Syndrome: The ACTIVIH Study" [EBioMedicine 8 (2016) 265-276]
Affiliations
- PMID: 27554840
- PMCID: PMC5006728
- DOI: 10.1016/j.ebiom.2016.08.003
Item in Clipboard
Published Erratum
Corrigendum to "One of the Immune Activation Profiles Observed in HIV-1-Infected Adults with Suppressed Viremia is Linked to Metabolic Syndrome: The ACTIVIH Study" [EBioMedicine 8 (2016) 265-276]
EBioMedicine.
2016 Aug.
No abstract available
Figures
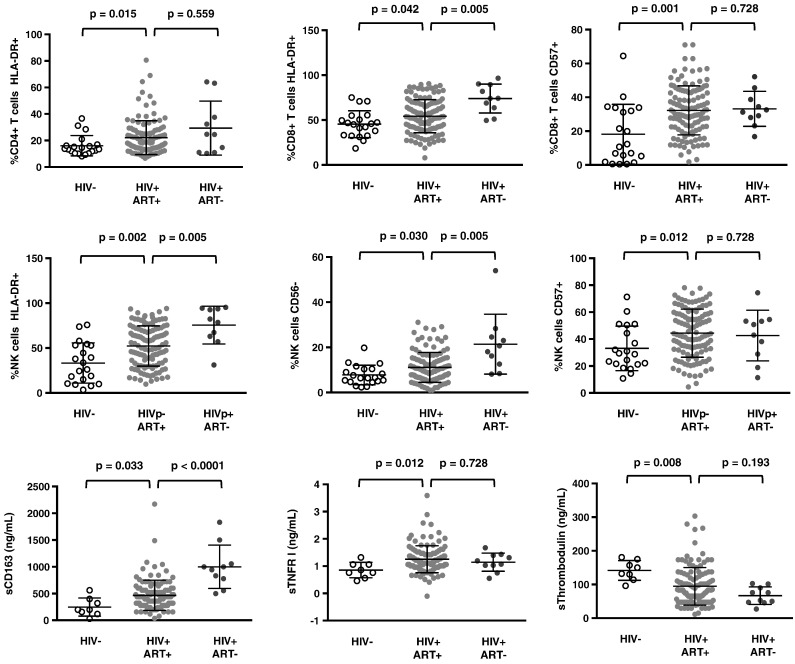
Immune activation in virologic responders. Percentages of various cell populations and plasma levels of soluble markers in healthy donors (HIV-), treated (HIV + ART +), and untreated (HIV + ART–) HIV patients. Data are presented as mean values and 95% confidence intervals; p-values are shown.

Variables factor map resulting from Principal Component Analysis. The variables are represented by arrows. The elbow test was carried out in order to select the number of components to consider. This was done by plotting the components' eigenvalues according to their size and analyzing the point in the graph where the slope goes from “steep” to “flat” in order to keep only the components that are placed before the elbow, which were 2 in our case. The length of each of these arrows depends on the correlation of the variable with the component. Highly positively correlated variables are represented by arrows close to each other. Strongly negatively correlated variables are represented by arrows diametrically opposed.
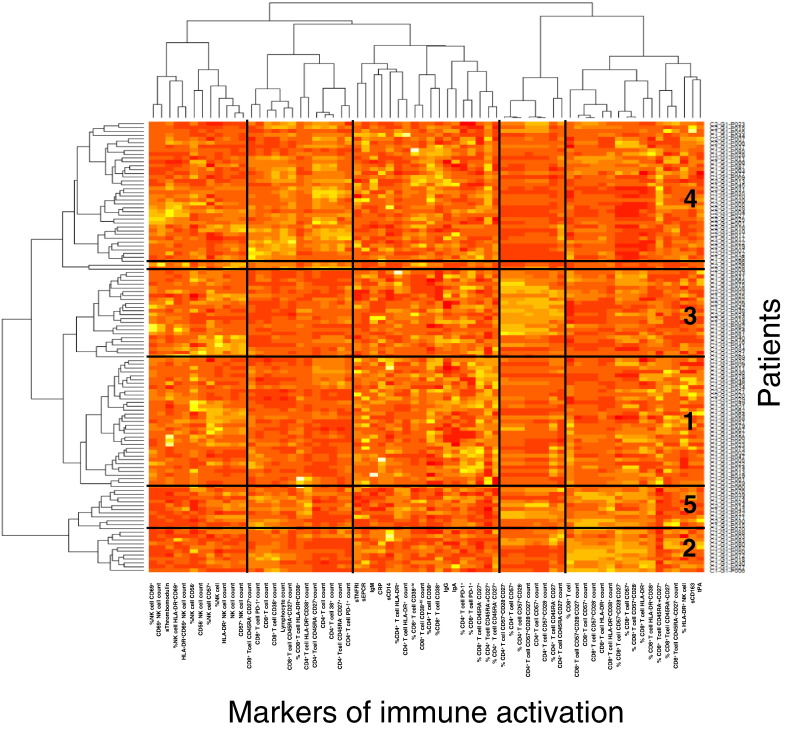
Virologic responders present with different immune activation profiles. Heatmap showing the hierarchical clustering of the activation markers (vertical) as well as of the virologic responders according to their profile of activation (horizontal). Each group number is indicated.

Characterization of the five different immune activation profiles. Differences in the levels of key activation markers between each group of patients and the other groups are represented. Data are presented as mean values and 95% confidence intervals; p-values are shown.

Link between immune activation profile 2 and marks of metabolic syndrome. Odd ratios relating each profile of immune activation to risk of hyperinsulinemia (a), hypertriglyceridemia (b), and lipodystrophy (c). Data are presented as OR and 95% confidence intervals.
Erratum for
-
One of the immune activation profiles observed in HIV-1-infected adults with suppressed viremia is linked to metabolic syndrome: The ACTIVIH study.EBioMedicine. 2016 Jun;8:265-276. doi: 10.1016/j.ebiom.2016.05.008. Epub 2016 May 10. EBioMedicine. 2016. PMID: 27428436 Free PMC article.
Publication types
LinkOut - more resources
Full Text Sources
Other Literature Sources
