

Understanding the spatiotemporal pattern of grazing cattle movement
- PMID: 27555220
- PMCID: PMC4995401
- DOI: 10.1038/srep31967
Understanding the spatiotemporal pattern of grazing cattle movement
Abstract
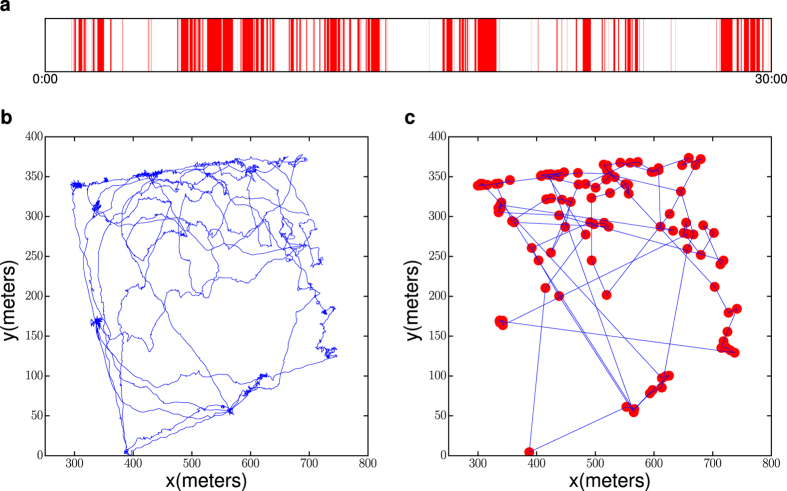
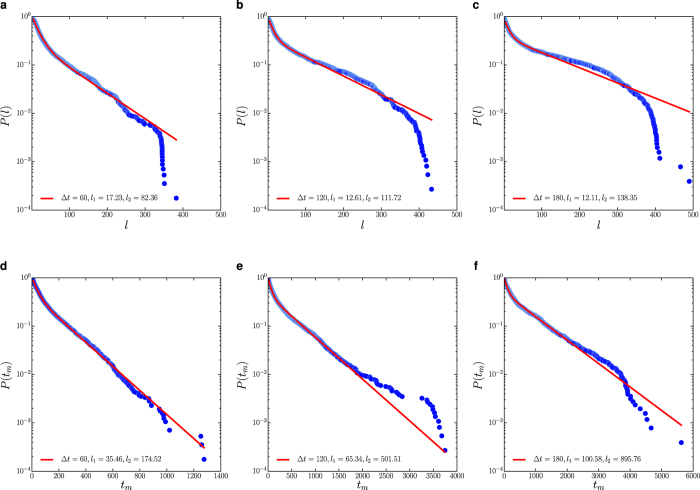
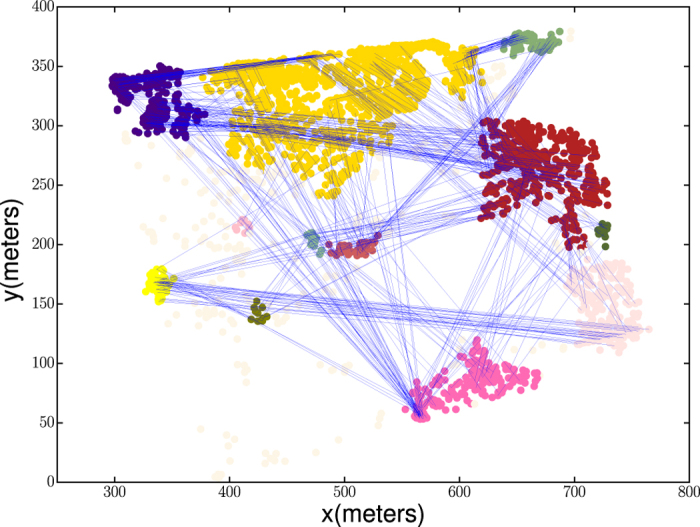
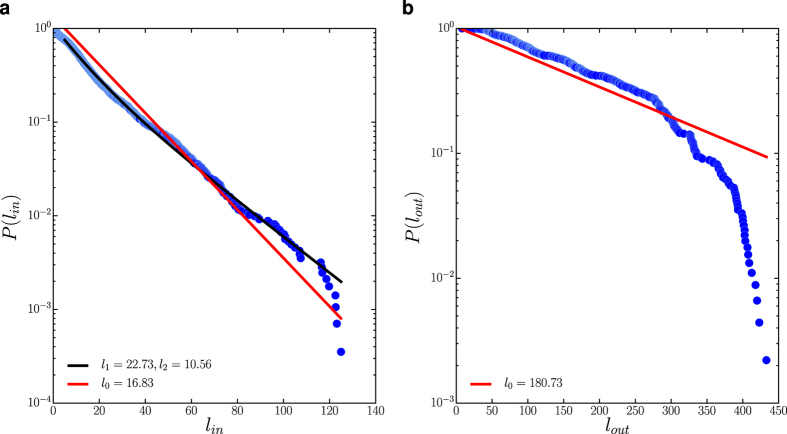
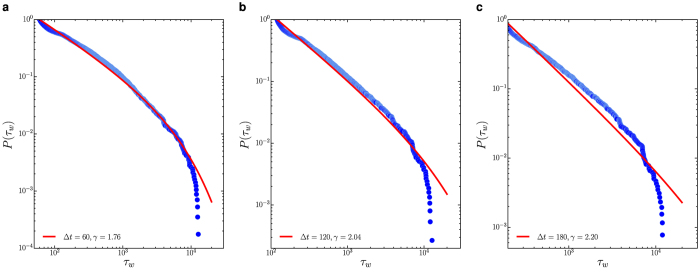
Understanding the drivers of animal movement is significant for ecology and biology. Yet researchers have so far been unable to fully understand these drivers, largely due to low data resolution. In this study, we analyse a high-frequency movement dataset for a group of grazing cattle and investigate their spatiotemporal patterns using a simple two-state 'stop-and-move' mobility model. We find that the dispersal kernel in the moving state is best described by a mixture exponential distribution, indicating the hierarchical nature of the movement. On the other hand, the waiting time appears to be scale-invariant below a certain cut-off and is best described by a truncated power-law distribution, suggesting that the non-moving state is governed by time-varying dynamics. We explore possible explanations for the observed phenomena, covering factors that can play a role in the generation of mobility patterns, such as the context of grazing environment, the intrinsic decision-making mechanism or the energy status of different activities. In particular, we propose a new hypothesis that the underlying movement pattern can be attributed to the most probable observable energy status under the maximum entropy configuration. These results are not only valuable for modelling cattle movement but also provide new insights for understanding the underlying biological basis of grazing behaviour.
Figures
Similar articles
-
A Theoretical Basis for Entropy-Scaling Effects in Human Mobility Patterns.PLoS One. 2016 Aug 29;11(8):e0161630. doi: 10.1371/journal.pone.0161630. eCollection 2016. PLoS One. 2016. PMID: 27571423 Free PMC article.
-
Mapping activity of grazing cattle using commercial virtual fencing technology.Front Vet Sci. 2025 Mar 12;12:1536977. doi: 10.3389/fvets.2025.1536977. eCollection 2025. Front Vet Sci. 2025. PMID: 40171406 Free PMC article.
-
Deriving Animal Behaviour from High-Frequency GPS: Tracking Cows in Open and Forested Habitat.PLoS One. 2015 Jun 24;10(6):e0129030. doi: 10.1371/journal.pone.0129030. eCollection 2015. PLoS One. 2015. PMID: 26107643 Free PMC article.
-
Environmental factors influencing transmission.Vet Parasitol. 1997 Nov;72(3-4):247-56; discussion 257-64. doi: 10.1016/s0304-4017(97)00100-3. Vet Parasitol. 1997. PMID: 9460201 Review.
-
Recent progress in the study of behavior and management in grazing cattle.Anim Sci J. 2011 Feb;82(1):26-35. doi: 10.1111/j.1740-0929.2010.00821.x. Epub 2010 Oct 29. Anim Sci J. 2011. PMID: 21269356 Review.
Cited by
-
Assessment of a livestock GPS collar based on an open-source datalogger informs best practices for logging intensity.Ecol Evol. 2018 May 7;8(11):5649-5660. doi: 10.1002/ece3.4094. eCollection 2018 Jun. Ecol Evol. 2018. PMID: 29938081 Free PMC article.
-
Traveling pulse emerges from coupled intermittent walks: A case study in sheep.PLoS One. 2018 Dec 5;13(12):e0206817. doi: 10.1371/journal.pone.0206817. eCollection 2018. PLoS One. 2018. PMID: 30517114 Free PMC article.
-
Spatiotemporal Mapping of Grazing Livestock Behaviours Using Machine Learning Algorithms.Sensors (Basel). 2025 Jul 23;25(15):4561. doi: 10.3390/s25154561. Sensors (Basel). 2025. PMID: 40807726 Free PMC article.
-
Description of Behavioral Patterns Displayed by a Recently Weaned Cohort of Healthy Dairy Calves.Animals (Basel). 2020 Dec 21;10(12):2452. doi: 10.3390/ani10122452. Animals (Basel). 2020. PMID: 33371394 Free PMC article.
-
Characterization of grazing behaviour microstructure using point-of-view cameras.PLoS One. 2022 Mar 18;17(3):e0265037. doi: 10.1371/journal.pone.0265037. eCollection 2022. PLoS One. 2022. PMID: 35302988 Free PMC article.
References
Publication types
MeSH terms
LinkOut - more resources
Full Text Sources
Other Literature Sources
