

Looking for a Signal in the Noise: Revisiting Obesity and the Microbiome
- PMID: 27555308
- PMCID: PMC4999546
- DOI: 10.1128/mBio.01018-16
Looking for a Signal in the Noise: Revisiting Obesity and the Microbiome
Erratum in
-
Erratum for Sze and Schloss, "Looking for a Signal in the Noise: Revisiting Obesity and the Microbiome".mBio. 2017 Dec 5;8(6):e01995-17. doi: 10.1128/mBio.01995-17. mBio. 2017. PMID: 29208750 Free PMC article. No abstract available.
Abstract
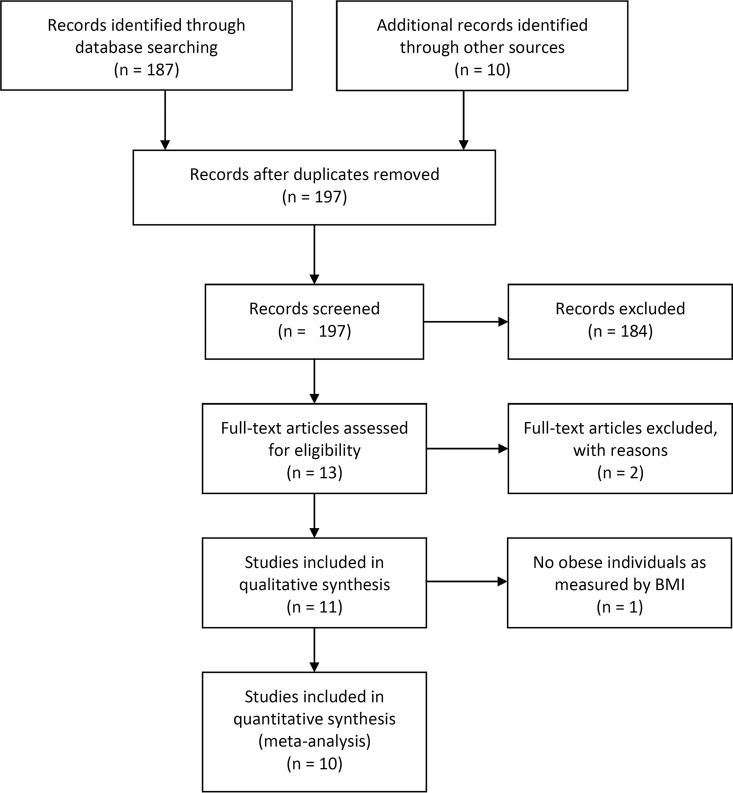
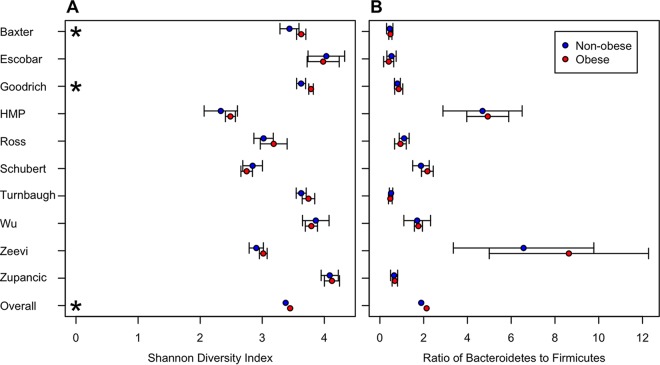
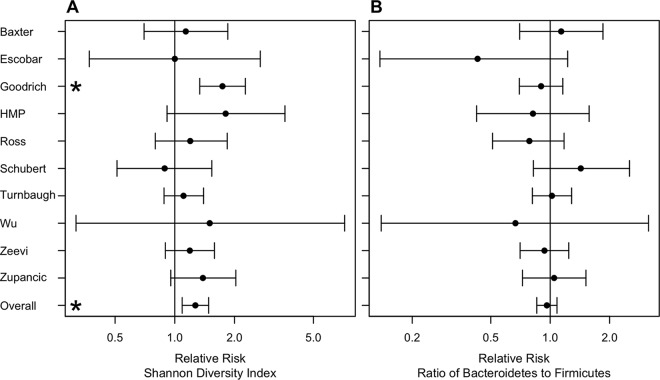
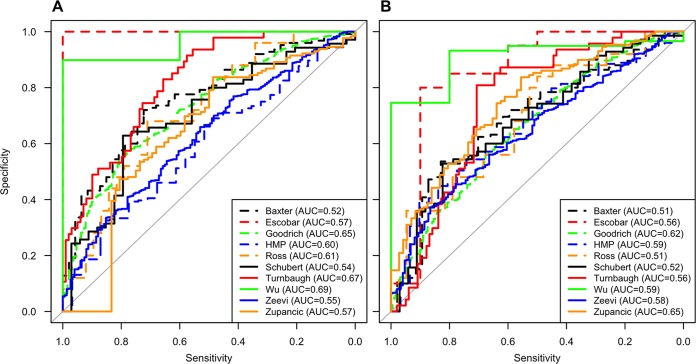
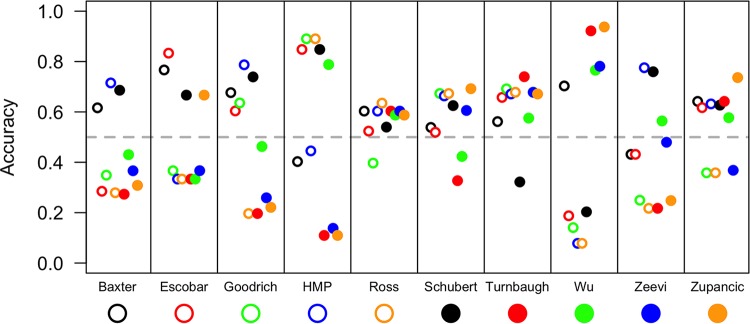
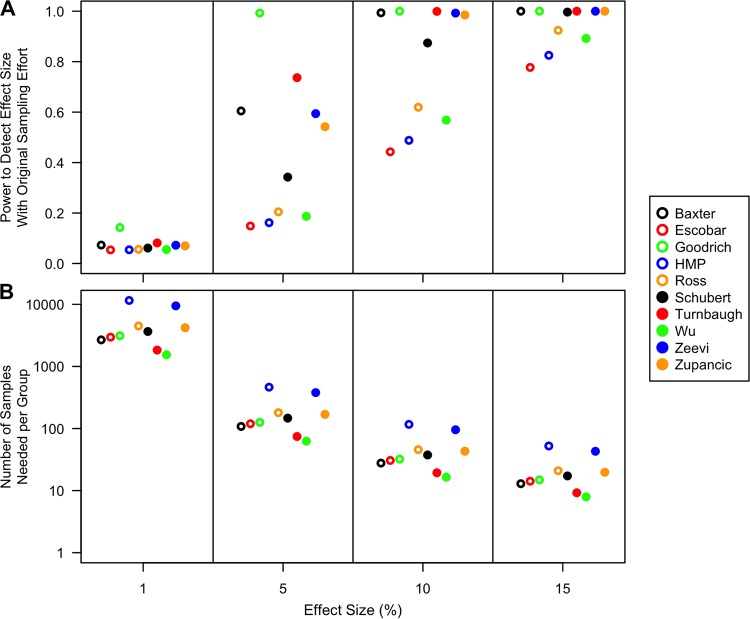
Two recent studies have reanalyzed previously published data and found that when data sets were analyzed independently, there was limited support for the widely accepted hypothesis that changes in the microbiome are associated with obesity. This hypothesis was reconsidered by increasing the number of data sets and pooling the results across the individual data sets. The preferred reporting items for systematic reviews and meta-analyses guidelines were used to identify 10 studies for an updated and more synthetic analysis. Alpha diversity metrics and the relative risk of obesity based on those metrics were used to identify a limited number of significant associations with obesity; however, when the results of the studies were pooled by using a random-effect model, significant associations were observed among Shannon diversity, the number of observed operational taxonomic units, Shannon evenness, and obesity status. They were not observed for the ratio of Bacteroidetes and Firmicutes or their individual relative abundances. Although these tests yielded small P values, the difference between the Shannon diversity indices of nonobese and obese individuals was 2.07%. A power analysis demonstrated that only one of the studies had sufficient power to detect a 5% difference in diversity. When random forest machine learning models were trained on one data set and then tested by using the other nine data sets, the median accuracy varied between 33.01 and 64.77% (median, 56.68%). Although there was support for a relationship between the microbial communities found in human feces and obesity status, this association was relatively weak and its detection is confounded by large interpersonal variation and insufficient sample sizes.
Importance: As interest in the human microbiome grows, there is an increasing number of studies that can be used to test numerous hypotheses across human populations. The hypothesis that variation in the gut microbiota can explain or be used to predict obesity status has received considerable attention and is frequently mentioned as an example of the role of the microbiome in human health. Here we assessed this hypothesis by using 10 independent studies and found that although there is an association, it is smaller than can be detected by most microbiome studies. Furthermore, we directly tested the ability to predict obesity status on the basis of the composition of an individual's microbiome and found that the median classification accuracy is between 33.01 and 64.77%. This type of analysis can be used to design future studies and expanded to explore other hypotheses.
Copyright © 2016 Sze and Schloss.
Figures
References
Publication types
MeSH terms
Grants and funding
LinkOut - more resources
Full Text Sources
Other Literature Sources
Medical
Research Materials
