. 2016 Nov;10(9):1437-1449.
doi: 10.1016/j.molonc.2016.08.001. Epub 2016 Aug 9.

A large-scale analysis of alternative splicing reveals a key role of QKI in lung cancer

Affiliations

A large-scale analysis of alternative splicing reveals a key role of QKI in lung cancer

Fernando J de Miguel et al. Mol Oncol. 2016 Nov.

Abstract

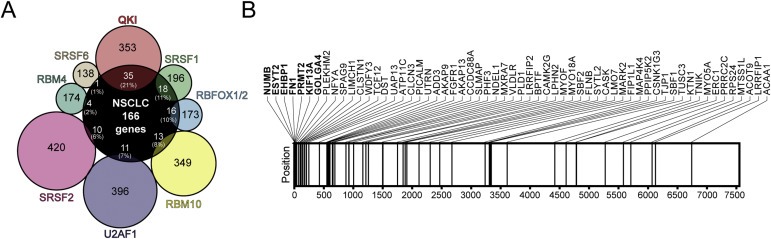
Increasing interest has been devoted in recent years to the understanding of alternative splicing in cancer. In this study, we performed a genome-wide analysis to identify cancer-associated splice variants in non-small cell lung cancer. We discovered and validated novel differences in the splicing of genes known to be relevant to lung cancer biology, such as NFIB, ENAH or SPAG9. Gene enrichment analyses revealed an important contribution of alternative splicing to cancer-related molecular functions, especially those involved in cytoskeletal dynamics. Interestingly, a substantial fraction of the altered genes found in our analysis were targets of the protein quaking (QKI), pointing to this factor as one of the most relevant regulators of alternative splicing in non-small cell lung cancer. We also found that ESYT2, one of the QKI targets, is involved in cytoskeletal organization. ESYT2-short variant inhibition in lung cancer cells resulted in a cortical distribution of actin whereas inhibition of the long variant caused an increase of endocytosis, suggesting that the cancer-associated splicing pattern of ESYT2 has a profound impact in the biology of cancer cells. Finally, we show that low nuclear QKI expression in non-small cell lung cancer is an independent prognostic factor for disease-free survival (HR = 2.47; 95% CI = 1.11-5.46, P = 0.026). In conclusion, we identified several splicing variants with functional relevance in lung cancer largely regulated by the splicing factor QKI, a tumor suppressor associated with prognosis in lung cancer.

Keywords: Alternative splicing; ESYT2; Non-small cell lung cancer; QKI.


Figures

Figure 1
Figure 1
Analysis of the alternative splicing events identified by ExonPointer in NSCLC. A. Differential alternative splicing was confirmed by PCR in 14 out of the top 20 genes selected by ExonPointer. The relative percentage of each isoform was measured by densitometry in 10 randomly selected clinical cases. Percentages are shown as mean ± SEM. In the case of CEACAM1, the difference was not statistically significant. N: Non‐tumor tissue, T: Tumor tissue. B. PCR validation of differential alternative splicing events in genes ranked by ExonPointer at positions: 97th (SPAG9), 98th (LIMCH1), 99th (KIAA1217), 155th (ERBB2IP) and 233th (ITGB4). C. DAVID Functional Annotation Chart for genes within the first 250 events selected by ExonPointer based on annotations from several databases. Categories are ordered by P value. The number of genes included in each category is also showed. GO: Gene Ontology, BP: Biological Process, MF: Molecular Function, CC: Cellular Component, SP: SwissProt, IP: InterPro, UP: UniProt. *P < 0.05; **P < 0.01; ***P < 0.001.
Figure 2
Figure 2
QKI is a key regulator of splicing in NSCLC. A. Venn diagram of the targets of lung cancer‐related splicing factors common to 166 genes corresponding to top 250 differentially‐spiced events identified by ExonPointer. The list of targets was obtained from the literature: QKI (Zong et al., 2014), SRSF1 (de Miguel et al., 2014), RBFOX1/2 (Zhang et al., 2008), RBM10 (Wang et al., 2013b), U2AF1 (Shirai et al., 2015), SRSF2 (Zhang et al., 2015), RBM4 (Wang et al., 2014) and SRSF6 (Jensen et al., 2014). Approximate percentages represent the proportion of genes in the ExonPointer list that are targets for a given splicing factor. B. Schematic representation of the positions occupied by 60 QKI targets, according to Zong et al. (Zong et al., 2014), in the ranked list generated by ExonPointer. Genes among the top 20 are depicted in bold. Horizontal lines represent the position of each gene in the list. A statistically significant overrepresentation of QKI target genes was observed in the ExonPointer list (P < 0.001).
Figure 3
Figure 3
ESYT2 splice variants regulate cytoskeleton and clathrin organization. A. Representative scheme of ESYT2 splicing variants: ESYT2‐L (long) and ESYT2‐S (short). Exon 13B retention disrupts the domain C2B. B. Relative percentage of each ESYT2 splicing isoform measured by PCR in 48 lung cancer cell lines ordered by ESYT2‐S expression. C. Isoform specific inhibition of ESYT2 with siRNAs in A549 cells. Mean ± SEM from three independent experiments is shown. D. α‐tubulin and F‐actin staining in A549 cells after variant‐specific siRNA inhibition. Scale bar: 20 μm. Histograms represent F‐actin fluorescence intensity measured in arbitrary units from A‐to‐B straight line (approximately 40 μm). Bar plot represents F‐actin intensity in the cortical area (5 μm from the plasma membrane) and the cytoplasm. Mean ± SEM of 30 independent cells is shown. E. Transferrin staining in A549 cells after variant‐specific siRNA inhibition. Scale bar: 20 μm. Bar plot represents transferrin fluorescence intensity measured in arbitrary units in the peripheral area of the nucleus (5 μm from the nuclear perimeter). Mean ± SEM of 15–20 independent cells is shown. **P < 0.01; ***P < 0.001.
Figure 4
Figure 4
QKI expression is downregulated in lung cancer and is associated with poor prognosis. A. QKI protein expression, as determined by Western blotting, in 7 lung tumors and matched non‐tumor lung tissues. Dot plots show the expression of total QKI (gray), QKI‐5 (red) and QKI‐6 (blue), normalized with β‐actin and measured by densitometry. Mean + IQR is shown. Histogram represents the relative expression of the QKI isoforms, measured by densitometry, in the 7 paired samples. N: Non‐tumor tissue, T: Tumor tissue B‐E. Representative QKI immunohistochemical stainings. (B) Bronchial epithelium. (C) Lung parenchyma. (D) Squamous cell carcinoma of the lung. (E) Lung adenocarcinoma. QKI expression was predominantly nuclear. Scale bar: 50 μm. F. H‐score of nuclear QKI staining in bronchioles (Bro), alveoli (Alv) and lung tumors (Tum). Median + IQR is shown. G. Kaplan–Meier survival curves. Patients were divided into low and high QKI expression using the median of the H‐score values as cut‐off. The P value of the log rank test is shown. *P < 0.05; **P < 0.01; ***P < 0.001.

References

    1. Barretina, J. , Caponigro, G. , Stransky, N. , Venkatesan, K. , Margolin, A.A. , Kim, S. , Wilson, C.J. , Lehar, J. , Kryukov, G.V. , Sonkin, D. , Reddy, A. , Liu, M. , Murray, L. , Berger, M.F. , Monahan, J.E. , Morais, P. , Meltzer, J. , Korejwa, A. , Jane-Valbuena, J. , Mapa, F.A. , Thibault, J. , Bric-Furlong, E. , Raman, P. , Shipway, A. , Engels, I.H. , Cheng, J. , Yu, G.K. , Yu, J. , Aspesi, P. , de Silva, M. , Jagtap, K. , Jones, M.D. , Wang, L. , Hatton, C. , Palescandolo, E. , Gupta, S. , Mahan, S. , Sougnez, C. , Onofrio, R.C. , Liefeld, T. , MacConaill, L. , Winckler, W. , Reich, M. , Li, N. , Mesirov, J.P. , Gabriel, S.B. , Getz, G. , Ardlie, K. , Chan, V. , Myer, V.E. , Weber, B.L. , Porter, J. , Warmuth, M. , Finan, P. , Harris, J.L. , Meyerson, M. , Golub, T.R. , Morrissey, M.P. , Sellers, W.R. , Schlegel, R. , Garraway, L.A. , 2012. The Cancer Cell Line Encyclopedia enables predictive modelling of anticancer drug sensitivity. Nature. 483, 603–607. - PMC - PubMed
    1. Bechara, E.G. , Sebestyen, E. , Bernardis, I. , Eyras, E. , Valcarcel, J. , 2013. RBM5, 6, and 10 differentially regulate NUMB alternative splicing to control cancer cell proliferation. Mol. Cel. 52, 720–733. - PubMed
    1. Bezanilla, M. , Gladfelter, A.S. , Kovar, D.R. , Lee, W.L. , 2015. Cytoskeletal dynamics: a view from the membrane. J. Cel. Biol. 209, 329–337. - PMC - PubMed
    1. Biamonti, G. , Catillo, M. , Pignataro, D. , Montecucco, A. , Ghigna, C. , 2014. The alternative splicing side of cancer. Semin. Cel. Dev. Biol. 32, 30–36. - PubMed
    1. Bian, Y. , Wang, L. , Lu, H. , Yang, G. , Zhang, Z. , Fu, H. , Lu, X. , Wei, M. , Sun, J. , Zhao, Q. , Dong, G. , Lu, Z. , 2012. Downregulation of tumor suppressor QKI in gastric cancer and its implication in cancer prognosis. Biochem. Biophys. Res. Commun. 422, 187–193. - PubMed

Publication types