. 2016 Aug 24:7:12536.
doi: 10.1038/ncomms12536.

Spontaneous perception of numerosity in humans

Affiliations

Spontaneous perception of numerosity in humans

Guido Marco Cicchini et al. Nat Commun. .

Abstract

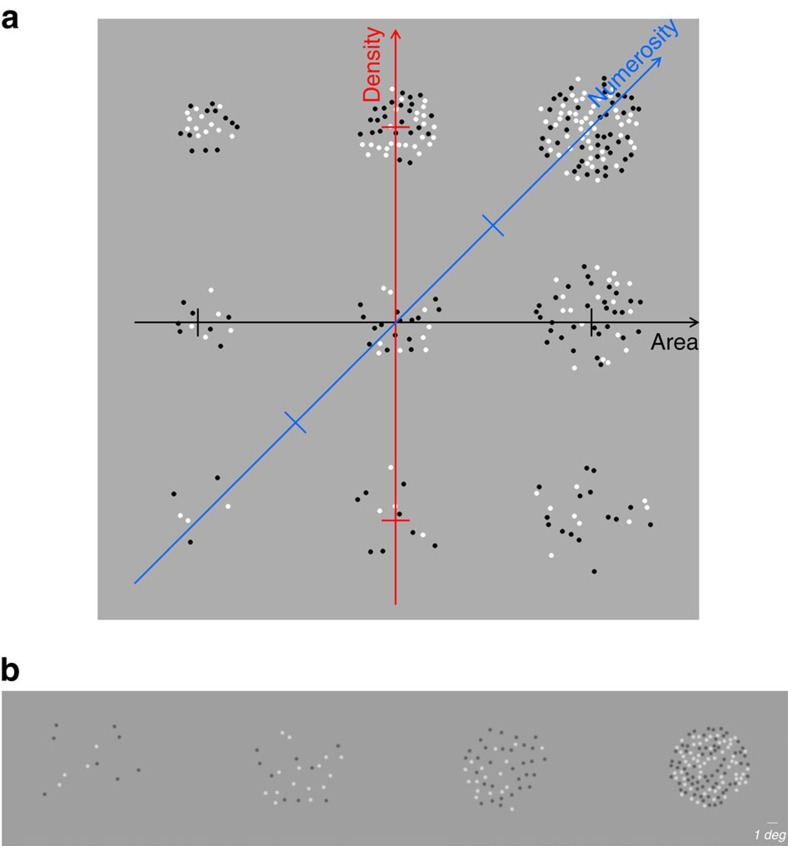
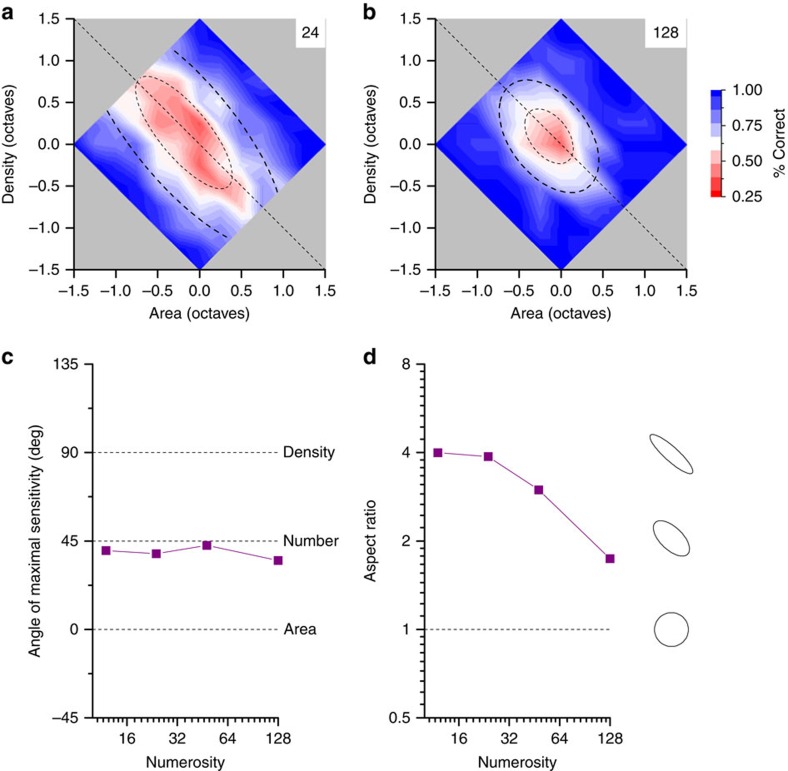
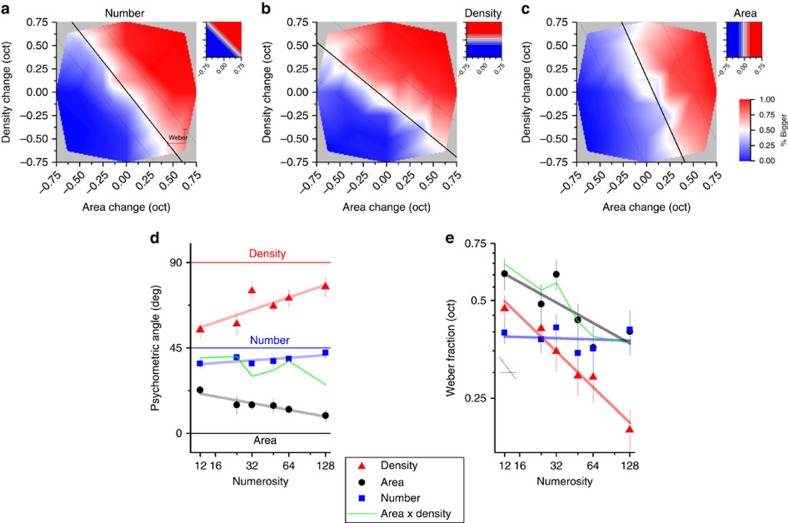
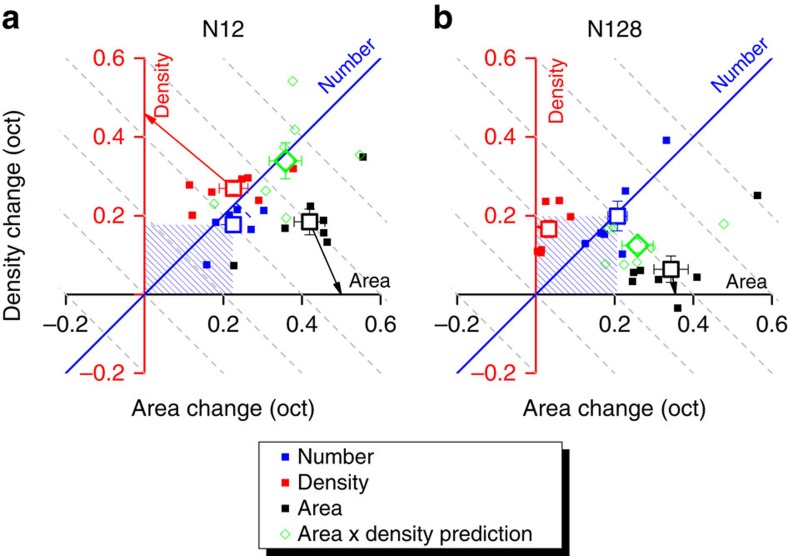
Humans, including infants, and many other species have a capacity for rapid, nonverbal estimation of numerosity. However, the mechanisms for number perception are still not clear; some maintain that the system calculates numerosity via density estimates-similar to those involved in texture-while others maintain that more direct, dedicated mechanisms are involved. Here we show that provided that items are not packed too densely, human subjects are far more sensitive to numerosity than to either density or area. In a two-dimensional space spanning density, area and numerosity, subjects spontaneously react with far greater sensitivity to changes in numerosity, than either area or density. Even in tasks where they were explicitly instructed to make density or area judgments, they responded spontaneously to number. We conclude, that humans extract number information, directly and spontaneously, via dedicated mechanisms.


Figures

Figure 1
Figure 1. Area–density stimulus space.
(a) Schematic illustration of the 2D space describing the stimuli used in this study. The origin is the ‘standard' stimulus for a specific condition, always of radius 3.6 degrees (area 40 sq degrees), with 12, 24, 32, 48, 64 or 128 dots (density ranged from 0.3 to 3.2 dots per deg2). The abscissa plots relative stimulus area, and the ordinate relative density. The positive diagonal represents relative number. Lines orthogonal to this diagonal have constant number. All axes are logarithmic: each tick shows an octave (base-two logarithm) interval, a doubling or halving of that quantity. Note this is a schematic illustration. (b) Example of the actual stimuli for numerosities 12, 24, 48 and 128.
Figure 2
Figure 2. Discrimination boundaries in area–density space.
(a) 2D psychometric function for measuring thresholds in the area/density space with the ‘odd-one-out' task, for a standard of 24 dots. Per cent correct (pooled across two subjects) is plotted as a function of log area and log density (see heat map at right). The maps show interpolated responses. The raw data were fit with a 2D Gaussian varying between 100 and 33% (chance). The dashed lines show the 50 and 75% performance. (b) 2D psychometric function measured with a standard of 128 dots. Conventions as in A. (c) The orientation of the short radius (maximal sensitivity) of the best-fitting 2-D Gaussian, as a function of numerosity. The orientation tended to +45° at all numerosities, aligned with the number axis. (d) Ratio of s.d. of the long to short radii, as a function of numerosity. For low-to-moderate numerosities the oval was strongly elongated, by a factor of four. Even at the highest numerosity, the oval remained elongated orthogonal to the numerosity axis, with an aspect ratio of 1.7.
Figure 3
Figure 3. Explicit number area and density judgments in area–density space.
(a) 2D psychometric functions for explicit number comparisons (which patch appeared more numerous) for a standards 12 dots, plotting per cent ‘more' pooled across six subjects, as a function of log area and log density. The maps are obtained by linear interpolation (see heat map at right for values). The raw data are fitted with a 2D cumulative Gaussian error function, varying between 0 and 100%. The dashed lines show ±1 s.d.; Weber Fraction is the total change needed to attain 84% correct responses. The small insets at right show how an ideal observer would perform, responding correctly to the task. However, the data for all three tasks tended to oriented near the numerosity axis, suggesting that numerosity was used for all tasks. (b) Explicit density judgments: conventions as in a. (c) Explicit area judgments: conventions as in a. (d) The orientation of the choice axes (deviation from vertical), as a function of numerosity. For the numerosity task (blue symbols), the functions were oriented near +45° at all numerosities (orthogonal to the number axis), suggesting that numerosity provided the primary information for the task. The functions for density (red symbols) were also oriented near +45° at low numerosities, suggesting that density judgments also relied on numerosity. Area judgments (black symbols) were also strongly influenced by numerosity at low numerosities. The green curves show the predictions for numerosity judgments, if they were based on the product of density and area. (e) Weber fractions (log (change in area) + log(change in density) at threshold), as a function of numerosity. The lines are best-fitting linear regressions, with slopes of −0.36, −0.21 and −0.01 respectively for density (red triangle), area (black circle) and number. Weber fractions for number remained constant over the range (Weber's law), while density decreased with a slope near −0.5 (square root law). Area also decreased with numerosity. The green curves show the predictions for numerosity judgments, if they were based on the product of density and area. For high numerosities, the predictions are reasonable, but at low numerosities far too high.
Figure 4
Figure 4. Threshold changes for number density and area discrimination.
(a) Area and density thresholds (changes required to attain 84% consistent response) for the density, area and number judgments (respectively red, black and blue), for a base numerosity of 12 dots. Dashed lines orthogonal to the numerosity diagonal indicate regions of constant number. Small squares are individual data, large hollow squares (means), error bars are s.e.m. Arrows display projections on the physical axis of area and density thresholds on their respective axis. Green diamonds indicate the predicted thresholds for number if it were calculated from area and density (clearly far higher than actually obtained). (b) Like a, for base numerosity of 128.

References

    1. Agrillo C. & Bisazza A. Spontaneous versus trained numerical abilities. A comparison between the two main tools to study numerical competence in non-human animals. J. Neurosci. Meth. 234, 82–91 (2014). - PubMed
    1. Dehaene S. The Number Sense: How the Mind Creates Mathematics Oxford University Press (2011).
    1. Izard V., Sann C., Spelke E. S. & Streri A. Newborn infants perceive abstract numbers. Proc. Natl Acad. Sci. USA 106, 10382–10385 (2009). - PMC - PubMed
    1. Halberda J., Ly R., Wilmer J. B., Naiman D. Q. & Germine L. Number sense across the lifespan as revealed by a massive Internet-based sample. Proc. Natl Acad. Sci. USA 109, 11116–11120 (2012). - PMC - PubMed
    1. Anobile G., Stievano P. & Burr D. C. Visual sustained attention and numerosity sensitivity correlate with math achievement in children. J. Exp. Child. Psychol. 116, 380–391 (2013). - PubMed

Publication types

LinkOut - more resources