. 2016 Aug 24;12(8):e1005831.
doi: 10.1371/journal.ppat.1005831. eCollection 2016 Aug.

Placental Sequestration of Plasmodium falciparum Malaria Parasites Is Mediated by the Interaction Between VAR2CSA and Chondroitin Sulfate A on Syndecan-1

Affiliations

Placental Sequestration of Plasmodium falciparum Malaria Parasites Is Mediated by the Interaction Between VAR2CSA and Chondroitin Sulfate A on Syndecan-1

Marina Ayres Pereira et al. PLoS Pathog. .

Abstract

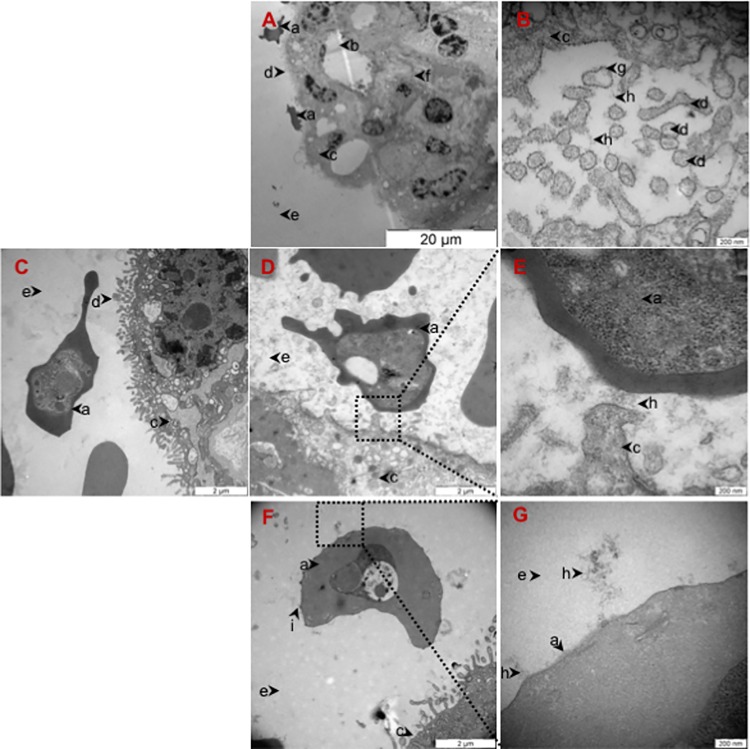
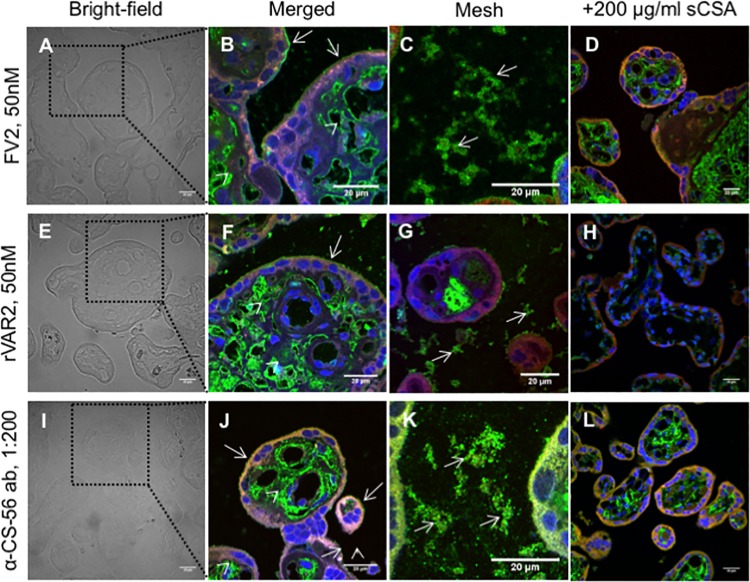
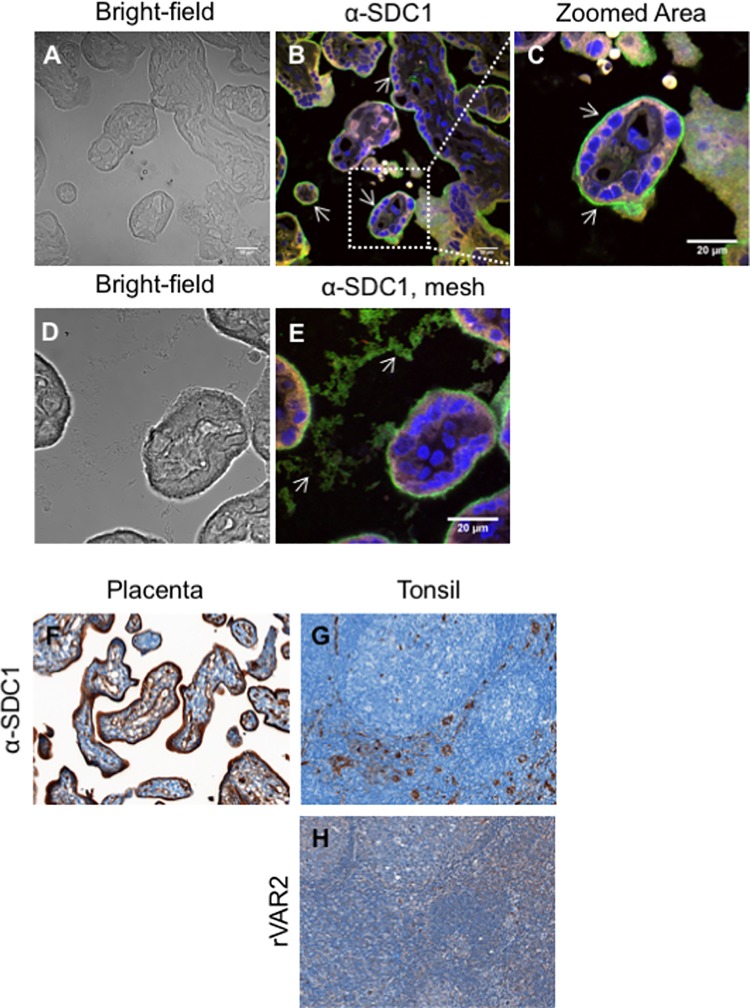
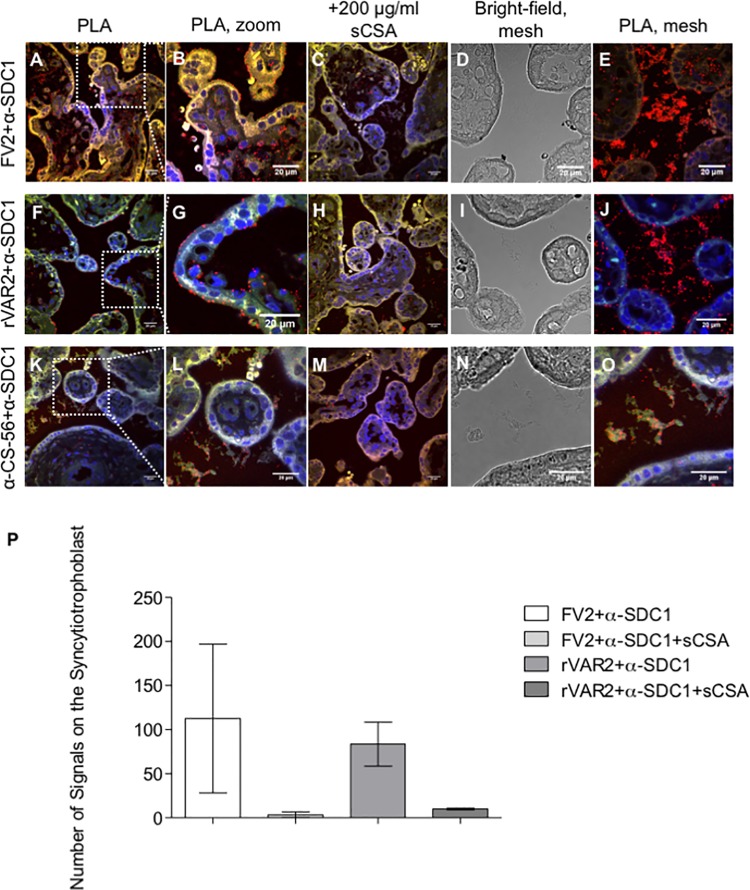
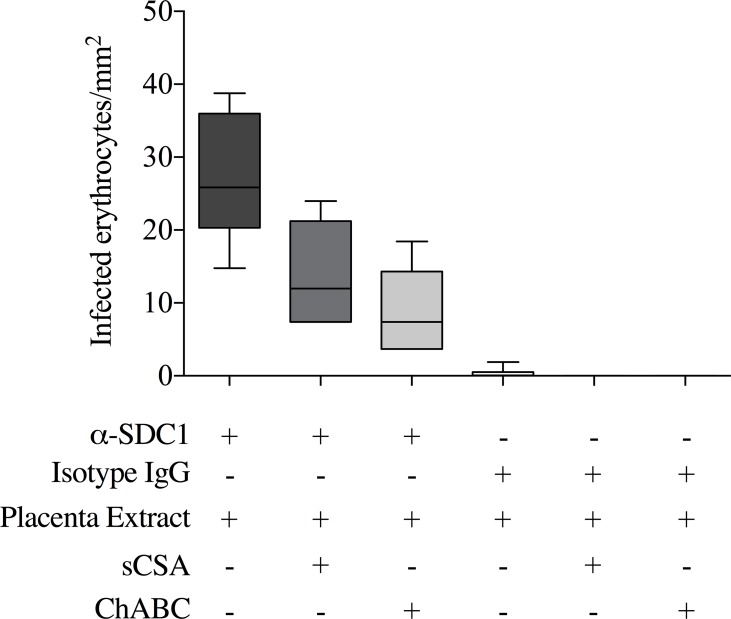
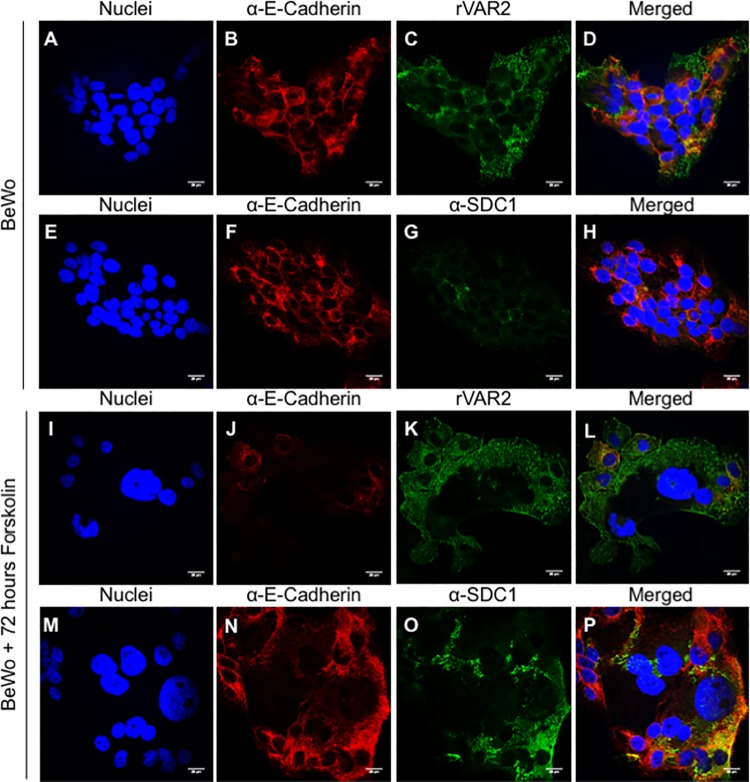
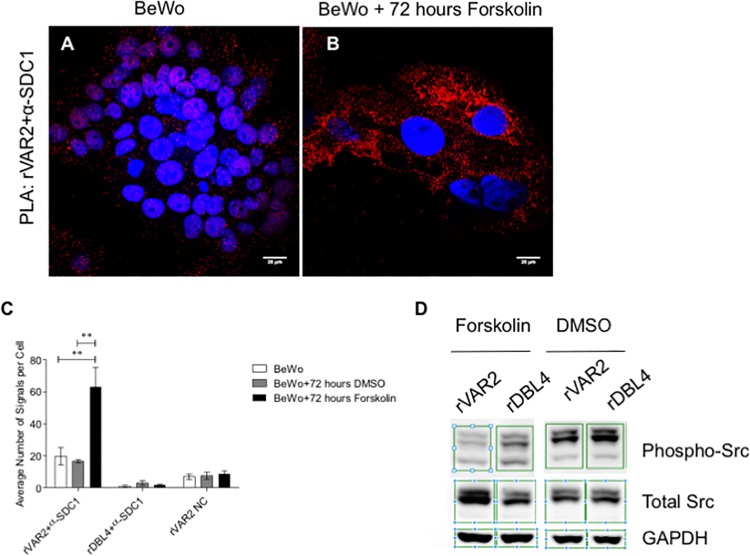
During placental malaria, Plasmodium falciparum infected erythrocytes sequester in the placenta, causing health problems for both the mother and fetus. The specific adherence is mediated by the VAR2CSA protein, which binds to placental chondroitin sulfate (CS) on chondroitin sulfate proteoglycans (CSPGs) in the placental syncytium. However, the identity of the CSPG core protein and the cellular impact of the interaction have remain elusive. In this study we identified the specific CSPG core protein to which the CS is attached, and characterized its exact placental location. VAR2CSA pull-down experiments using placental extracts from whole placenta or syncytiotrophoblast microvillous cell membranes showed three distinct CSPGs available for VAR2CSA adherence. Further examination of these three CSPGs by immunofluorescence and proximity ligation assays showed that syndecan-1 is the main receptor for VAR2CSA mediated placental adherence. We further show that the commonly used placental choriocarcinoma cell line, BeWo, express a different set of proteoglycans than those present on placental syncytiotrophoblast and may not be the most biologically relevant model to study placental malaria. Syncytial fusion of the BeWo cells, triggered by forskolin treatment, caused an increased expression of placental CS-modified syndecan-1. In line with this, we show that rVAR2 binding to placental CS impairs syndecan-1-related Src signaling in forskolin treated BeWo cells, but not in untreated cells.


Conflict of interest statement

The authors have declared that no competing interests exist.

Figures

Fig 1
Fig 1. Infected Erythrocytes adhere to CS present on the syncytiotrophoblast and in the intervillous space in the placenta.
(A) Transmission electron microscopy (TEM) of placental tissue glycosaminoglycans (GAGs) stained with 1% ruthenium red (RR) showing a fetal villus covered with syncytiotrophoblast. The surface of the syncytiotrophoblast is covered with microvilli. Two infected erythrocytes adhere to the apical membrane of the syncytiotrophoblast. Scale bar represents 20 μm. (B) TEM of placental tissue GAGs stained with 1% RR showing cross-sections of syncytiotrophoblast microvilli with the apical double layer plasma membrane surrounded by RR stained GAGs. Scale bar represents 200 nm. (C) TEM of control placental tissue perfused with VAR2CSA-expressing infected erythrocytes and not stained with RR. Scale bar represents 2 μm. (D) TEM of placental tissue perfused with VAR2CSA-expressing infected erythrocytes and stained with 1% RR showing the presence of GAGs where an infected erythrocyte is adhering to the syncytiotrophoblast membrane. Scale bar represents 2 μm.(E) TEM of higher magnification of the region outlined with a black square in (D) showing the presence of GAGs in between an infected erythrocyte and the syncytiotrophoblast. Scale bar represents 200 nm. (F) TEM of placental tissue stained with 1% RR showing an infected erythrocyte in the intervillous space close to the syncytiotrophoblast. Stained GAGs connected to knobs on an infected erythrocyte. Scale bar represents 2 μm. (G) TEM of higher magnification of the region outlined with a black square in (F) showing the presence of GAGs chains attached to knobs on an infected erythrocyte. Scale bar represents 200 nm.[a: infected erythrocyte; b: fetal capillary; c: syncytiotrophoblast; d: syncytiotrophoblast microvilli; e: intervillous space; f: villous stroma; g: double lipid layer; h: stained GAGs; i: knob].
Fig 2
Fig 2. Placental chondroitin sulfate recognized by VAR2CSA is present on the syncytiotrophoblast and in the intervillous space of the placenta.
Fresh placental tissue was perfused with VAR2CSA-expressing parasites before biopsies were collected and stained. A) Bright-field of placental tissue. The region delineated by a black dotted square is shown in (B). Scale bar represents 20 μm. (B) Full-length VAR2CSA (FV2) immunostaining show expression of placental CS in the villous stroma (arrow heads) and in the apical membrane of the syncytiotrophoblast (arrows). The image is a composite of three distinct channels: blue (nuclei), green (placental CS stained by FV2), and red (placenta auto-fluorescence). Scale bar represents 20 μm. (C) FV2 immunostaining showing the expression of placental CS in mesh-like structures (arrows). The image is a composite of three distinct channels: blue (nuclei), green (placental CS stained with FV2), and red (placenta auto-fluorescence). Scale bar represents 20 μm.(D) Addition of soluble CSA (sCSA) out-competes FV2 binding to placental tissue. The image is a composite of three distinct channels: blue (nuclei), green (placental CS stained with FV2), and red (placenta auto-fluorescence). Scale bar represents 20 μm. (E) Bright-field of placental tissue. The region delineated by a black dotted square is shown in (F). Scale bar represents 20 μm. (F) Recombinant VAR2CSA (rVAR2) immunostaining show the expression of placental CS in the villous stroma (arrow heads) and in the apical membrane of the syncytiotrophoblast (arrows). The image is a composite of three distinct channels: blue (nuclei), green (placental CS stained with rVAR2), and red (placenta auto-fluorescence). Scale bar represents 20 μm. (G) rVAR2 immunostaining show expression of placental CS in mesh-like structures (arrows). The image is a composite of three distinct channels: blue (nuclei), green (placental CS stained with rVAR2), and red (placenta auto-fluorescence). Scale bar represents 20 μm.(H) Addition of soluble CSA (sCSA) out-competes rVAR2 binding. The image is a composite of three distinct channels: blue (nuclei), green (placental CS stained with rVAR2), and red (placenta auto-fluorescence). Scale bar represents 20 μm. (I) Bright-field of placental tissue. A region delineated by a black dotted square is shown in (I). Scale bar represents 20 μm. (J) Anti-CS-56 antibody (α-CS-56 ab) immunostaining show the expression of CS in the villous stroma (arrow heads) and in the apical membrane of the syncytiotrophoblast (arrows). The image is a composite of three distinct channels: blue (nuclei), green (CS stained with α-CS-56 ab), and red (placenta auto-fluorescence). Scale bar represents 20 μm. (K) α-CS-56 ab immunostaining show the expression of CS in mesh-like structures (arrows). The image is a composite of three distinct channels: blue (nuclei), green (CS stained with α-CS-56 ab), and red (placenta auto-fluorescence). Scale bar represents 20 μm.m(L) Addition of soluble CSA (sCSA) out-competes α-CS-56 ab binding. The image is a composite of three distinct channels: blue (nuclei), green (CS stained with α-CS-56 ab), and red (placenta auto-fluorescence). Scale bar represents 20 μm.
Fig 3
Fig 3. Expression of SDC1 in placental and tonsil tissue.
(A) Bright-field of placental tissue perfused with VAR2CSA-expressing parasites showing infected erythrocytes adhering to the syncytiotrophoblast membrane. The same placenta region is shown stained in (B). (B) Immunostaining of paraffin-embedded placental tissue perfused with VAR2CSA-expressing parasites with an anti-syndecan-1 (SDC1) antibody showing SDC1 expression in the apical membrane of the syncytiotrophoblast (arrows). The image is a composite of three distinct channels: blue (nuclei), green (SDC1 staining), and red (placenta auto-fluorescence). Scale bar represents 20 μm. (C) Higher magnification of the region outlined with a white square in (B) showing more detail of placental SDC1 expression in the syncytiotrophoblast apical membrane (arrows). Scale bar represents 20μm. (D) Bright-field of placental tissue perfused with VAR2CSA-expressing parasites showing an infected erythrocyte adhering to the syncytiotrophoblast apical membrane and the presence of a mesh-like structure in the intervillous space. The same placenta region is shown stained in (E). (E) Immunostaining of paraffin-embedded placental tissue perfused with VAR2CSA-expressing parasites with an anti-syndecan-1 (SDC1) antibody showing the presence of SDC1 in the mesh-like structure present in the intervillous space (arrows). The image is a composite of three distinct channels: blue (nuclei), green (SDC1 staining), and red (placenta auto-fluorescence). Scale bar represents 20 μm. (F) Immunostaining of first-trimester placental tissue with an anti-syndecan-1 (SDC1) antibody showing the expression of SDC1 in the syncytiotrophoblast. Scale bar represents 20 μm. (G) Immunostaining of tonsil tissue with an anti-syndecan-1 (SDC1) antibody showing the expression of SDC1 in tonsil. Scale bar represents 20 μm. (H) Immunostaining of first-trimester placental tissue with rVAR2 showing the absence of the placental-type CS in the tonsil. Scale bar represents 20 μm.
Fig 4
Fig 4. Co-localization between placental CS and SDC1 in third-trimester placental tissue.
(A) Co-localization analysis by PLA between placental CS (FV2 stain) and syndecan-1 (SDC1) on paraffin-embedded placental tissue perfused with VAR2CSA-expressing parasites showing the Co-localization of SDC1 and placental CS chains in the syncytiotrophoblast and villous stroma (red dots). The image is a composite of three distinct channels: blue (nuclei), green (placenta auto-fluorescence), and red (co-localization between FV2 stain and SDC1). Scale bar represents 20 μm. (B) Higher magnification of the region outlined with a white square in (A) showing more detail of the co-localization between FV2 staining and SDC1 in the syncytiotrophoblast. Scale bar represents 20 μm. (C) Addition of soluble CSA (sCSA) confirms the specificity of FV2 by reducing the number of signals seen in the Co-localization between FV2 stain and SDC1. The image is a composite of three distinct channels: blue (nuclei), green (placenta auto-fluorescence), and red (co-localization between FV2 stain and SDC1). Scale bar represents 20 μm. (D) Bright-field visualization of placental tissue perfused with VAR2CSA-expressing parasites showing the presence of a mesh-like structure in the intervillous space. The same region is shown stained in (E). Scale bar represents 20 μm. (E) Co-localization of placental CS (FV2 stain) and syndecan-1 (SDC1) on mesh-like structure present in the intervillous space. The image is a composite of three distinct channels: blue (nuclei), green (placenta auto-fluorescence), and red (co-localization between FV2 stain and SDC1). Scale bar represents 20 μm. (F) Co-localization by PLA between placental CS (rVAR2 stain) and syndecan-1 (SDC1) on paraffin-embedded placental tissue perfused with VAR2CSA-expressing parasites showing the presence of placental CS carrying SDC1 on the apical side of the syncytiotrophoblast membrane (red dots). The image is a composite of three distinct channels: blue (nuclei), green (placenta auto-fluorescence), and red (co-localization between rVAR2 stain and SDC1). Scale bar represents 20 μm. (G) Higher magnification of the region outlined with a white square in (F) showing more detail of the co-localization between rVAR2 stain and SDC1 on the apical membrane of the syncytiotrophoblast. Picture shows an infected erythrocyte adhering in the syncytiotrophoblast close to co-localization events. Scale bar represents 20 μm. (H) Addition of soluble CSA (sCSA) confirms the specificity of rVAR2 by reducing the number of signals seen in the Co-localization between rVAR2 stain and SDC1. The image is a composite of three distinct channels: blue (nuclei), green (placenta auto-fluorescence), and red (co-localization between rVAR2 stain and SDC1). Scale bar represents 20 μm. (I) Bright-field visualization of placental tissue perfused with VAR2CSA-expressing parasites showing the presence of a mesh-like structure in the intervillous space. The same placenta region is shown stained in (J). (J) Co-localization by PLA between placental CS (rVAR2 stain) and SDC1 on paraffin-embedded placental tissue perfused with VAR2CSA-expressing parasites showing the presence of a high amount of placental CS carrying SDC1 in the mesh-like structure present in the intervillous space (red dots). The image is a composite of three distinct channels: blue (nuclei), green (placenta auto-fluorescence), and red (co-localization between rVAR2 stain and SDC1). Scale bar represents 20 μm. (K) Co-localization by PLA between CS (α-CS-56 antibody stain) and syndecan-1 (SDC1) on paraffin-embedded placental tissue perfused with VAR2CSA-expressing parasites showing the presence of CS on SDC1 in the syncytiotrophoblast (red dots). The image is a composite of three distinct channels: blue (nuclei), green (placenta auto-fluorescence), and red (co-localization between α-CS-56 antibody stain and SDC1). Scale bar represents 20 μm. (L) Higher magnification of the region outlined with a white square in (K) showing more detail of the co-localization between α-CS-56 antibody stain and SDC1 in the syncytiotrophoblast. Scale bar represents 20 μm. (M) Addition of soluble CSA (sCSA) does not decrease the detection of SDC1 with CS chains (detected with an α-CS-56 antibody) in the placental tissue perfused with VAR2CSA-expressing parasites. The image is a composite of three distinct channels: blue (nuclei), green (placenta auto-fluorescence), and red (co-localization between α-CS-56 antibody stain and SDC1). Scale bar represents 20 μm. (N) Bright-field visualization of placental tissue perfused with VAR2CSA-expressing parasites showing the presence of a mesh-like structure in the intervillous space. The same placenta region is shown stained in (O). (O) Co-localization by PLA between CS (α-CS-56 antibody stain) and SDC1 on paraffin-embedded placental tissue perfused with VAR2CSA-expressing parasites showing the presence of CS on SDC1 in the mesh-like structure present in the intervillous space (red dots). The image is a composite of three distinct channels: blue (nuclei), green (placenta auto-fluorescence), and red (co-localization between α-CS-56 antibody stain and SDC1). Scale bar represents 20 μm. (P) Quantification of the number of PLA signals representing the co-localization between SDC1 and CS (detected with FV2 and rVAR2) on the syncytiotrophoblast, in the presence or absence of sCSA. Signals were quantified manually. Values represent mean ± SEM.
Fig 5
Fig 5. Binding of infected erythrocytes to placental SDC1.
The figure shows the number of infected erythrocytes that bound (per mm2) to placental CSPG captured by an immobilized anti-SDC1 antibody or an isotype control IgG. For each setup, 2 replicates were run, and 3 representative pictures were taken for each of the replicates for quantification. The binding of the infected erythrocytes to SDC1 captured from the placental extract was confirmed in three independent experiments. sCSA denotes inhibition of binding using 400ug/mL soluble sigma CSA. ChABC denotes capture of CSPGs from placental extract pre-digested with Chondroitinase ABC.
Fig 6
Fig 6. Expression of placental CS and SDC1 in BeWo cells before and after forskolin treatment by immunofluorescence.
(A-D) Immunostaining of BeWo cells showing expression of E-cadherin (red) and placental CS at the cell surface (green). Cells are counterstained with DAPI (blue). Scale bar represents 20 μm. (E-H) Immunostaining of BeWo cells showing expression of E-cadherin (red) and syndecan-1 (SDC1) at the cell surface (green). Cells are counterstained with DAPI (blue). Scale bar represents 20 μm. (I-L) Immunostaining of BeWo cells showing expression of E-cadherin (red) and placental CS (green) at the cell surface after 72 hours of forskolin treatment. Cells are counterstained with DAPI (blue). Scale bar represents 20 μm. (M-P) Immunostaining of BeWo cells showing expression of E-cadherin (red) and syndecan-1 (SDC1) (green) at the cell surface after 72 hours of forskolin treatment. Cells are counterstained with DAPI (blue). Scale bar represents 20 μm.
Fig 7
Fig 7. Co-localization between placental CS and SDC1 on BeWo cells before and after forskolin treatment, by PLA.
Signaling assay on BeWo cells before and after forskolin treatment. (A) Co-localization by PLA between placental CS (rVAR2 stain) and syndecan-1 (SDC1) (red dots). Cells are counterstained with DAPI (blue). Scale bar represents 20 μm. (B) Co-localization by PLA between placental CS (rVAR2 stain) and syndecan-1(SDC1) shows the presence of high amounts of SDC1 with placental CS chains at the surface of BeWo cells after forskolin treatment for 72 hours (red dots). Cells are counterstained with DAPI (blue). Scale bar represents 20 μm. (C) Quantification of PLA signals for the co-localization between rVAR2 and SDC1 on BeWo cells, control cells incubated with DMSO, and cells after forskolin treatment. Values are presented as mean ± SEM. Two-way ANOVA test was used. Two asterisks (**) indicate a significant (P < 0.01) difference from both the non-treated BeWo cells, and cells treated with DMSO. (D) Signaling assay on BeWo cells treated with DMSO or Forskolin, and incubated for 24 hours with rVAR2 or the non-CS binding domain, rDBL4. Antibodies detecting GAPDH, phosphorylation of Src in Tyrosine 416 (p-Src) and total Src were used to assess the effect of rVAR2 binding to the Src-related signaling pathway.

References

    1. Mendis K, Sina BJ, Marchesini P, Carter R. The neglected burden of Plasmodium vivax malaria. The American journal of tropical medicine and hygiene. 2001;64(1–2 Suppl):97–106. . - PubMed
    1. Hay SI, Guerra CA, Gething PW, Patil AP, Tatem AJ, Noor AM, et al. A world malaria map: Plasmodium falciparum endemicity in 2007. PLoS medicine. 2009;6(3):e1000048 10.1371/journal.pmed.1000048 - DOI - PMC - PubMed
    1. Smith JD, Chitnis CE, Craig AG, Roberts DJ, Hudson-Taylor DE, Peterson DS, et al. Switches in expression of Plasmodium falciparum var genes correlate with changes in antigenic and cytoadherent phenotypes of infected erythrocytes. Cell. 1995;82(1):101–10. - PMC - PubMed
    1. Su XZ, Heatwole VM, Wertheimer SP, Guinet F, Herrfeldt JA, Peterson DS, et al. The large diverse gene family var encodes proteins involved in cytoadherence and antigenic variation of Plasmodium falciparum-infected erythrocytes. Cell. 1995;82(1):89–100. . - PubMed
    1. Fried M, Duffy PE. Adherence of Plasmodium falciparum to chondroitin sulfate A in the human placenta. Science. 1996;272(5267):1502–4. Epub 1996/06/07. . - PubMed

Publication types