

Sex Differences and Growth-Related Adaptations in Bone Microarchitecture, Geometry, Density, and Strength From Childhood to Early Adulthood: A Mixed Longitudinal HR-pQCT Study
- PMID: 27556581
- PMCID: PMC5233447
- DOI: 10.1002/jbmr.2982
Sex Differences and Growth-Related Adaptations in Bone Microarchitecture, Geometry, Density, and Strength From Childhood to Early Adulthood: A Mixed Longitudinal HR-pQCT Study
Abstract
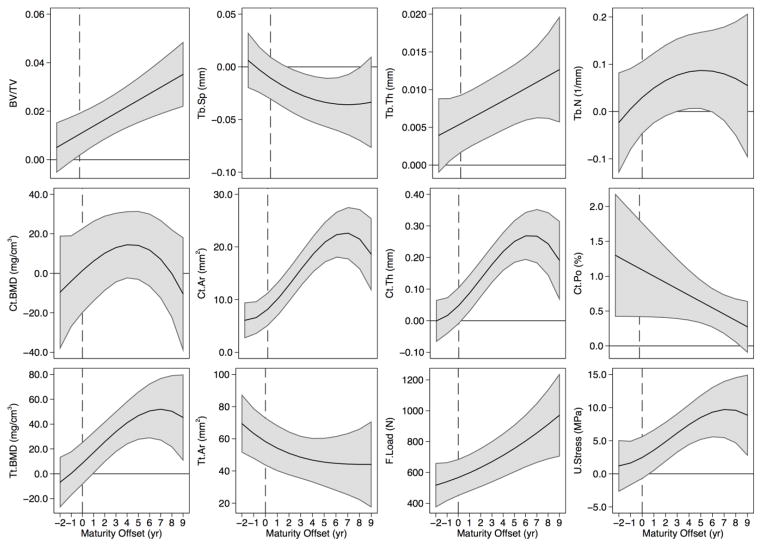
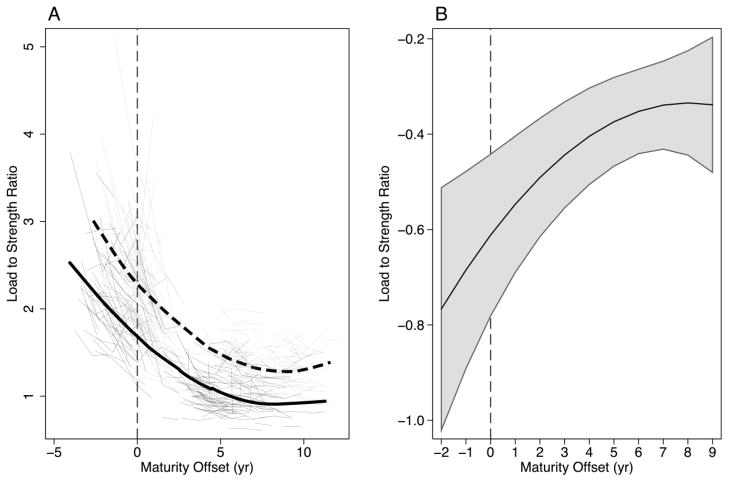
Sex differences in bone strength and fracture risk are well documented. However, we know little about bone strength accrual during growth and adaptations in bone microstructure, density, and geometry that accompany gains in bone strength. Thus, our objectives were to (1) describe growth related adaptations in bone microarchitecture, geometry, density, and strength at the distal tibia and radius in boys and girls; and (2) compare differences in adaptations in bone microarchitecture, geometry, density, and strength between boys and girls. We used HR-pQCT at the distal tibia (8% site) and radius (7% site) in 184 boys and 209 girls (9 to 20 years old at baseline). We aligned boys and girls on a common maturational landmark (age at peak height velocity [APHV]) and fit a mixed effects model to these longitudinal data. Importantly, boys showed 28% to 63% greater estimated bone strength across 12 years of longitudinal growth. Boys showed 28% to 80% more porous cortices compared with girls at both sites across all biological ages, except at the radius at 9 years post-APHV. However, cortical density was similar between boys and girls at all ages at both sites, except at 9 years post-APHV at the tibia when girls' values were 2% greater than boys'. Boys showed 13% to 48% greater cortical and total bone area across growth. Load-to-strength ratio was 26% to 27% lower in boys at all ages, indicating lower risk of distal forearm fracture compared with girls. Contrary to previous HR-pQCT studies that did not align boys and girls at the same biological age, we did not observe sex differences in Ct.BMD. Boys' superior bone size and strength compared with girls may confer them a protective advantage. However, boys' consistently more porous cortices may contribute to their higher fracture incidence during adolescence. Large prospective studies using HR-pQCT that target boys and girls who have sustained a fracture are needed to verify this. © 2016 American Society for Bone and Mineral Research.
Keywords: BONE ACCRUAL; BONE ARCHITECTURE; BONE STRENGTH; GROWTH; HR-PQCT.
© 2016 American Society for Bone and Mineral Research.
Conflict of interest statement
All authors state that they have no conflicts of interest.
Figures
Comment in
-
Reply to: Challenges in the Acquisition and Analysis of Bone Microstructure During Growth.J Bone Miner Res. 2016 Dec;31(12):2242-2243. doi: 10.1002/jbmr.3010. Epub 2016 Nov 2. J Bone Miner Res. 2016. PMID: 27704623 No abstract available.
-
Challenges in the Acquisition and Analysis of Bone Microstructure During Growth.J Bone Miner Res. 2016 Dec;31(12):2239-2241. doi: 10.1002/jbmr.3015. Epub 2016 Nov 1. J Bone Miner Res. 2016. PMID: 27736022 No abstract available.
References
-
- Järvinen TL, Sievänen H, Jokihaara J, Einhorn TA. Revival of Bone Strength: The Bottom Line. J Bone Miner Res. 2005;20(5):717–720. - PubMed
-
- Wang Q, Wang X-F, Iuliano-Burns S, Ghasem-Zadeh A, Zebaze R, Seeman E. Rapid growth produces transient cortical weakness: a risk factor for metaphyseal fractures during puberty. J Bone Miner Res. 2010;25(7):1521–1526. - PubMed
-
- Nishiyama KK, Macdonald HM, Moore SA, Fung T, Boyd SK, McKay HA. Cortical porosity is higher in boys compared with girls at the distal radius and distal tibia during pubertal growth: An HR-pQCT study. J Bone Miner Res. 2012;27(2):273–282. - PubMed
-
- Burrows M, Liu D, Moore S, McKay H. Bone microstructure at the distal tibia provides a strength advantage to males in late puberty: an HR-pQCT study. J Bone Miner Res. 2010;25(6):1423–1432. - PubMed
MeSH terms
Grants and funding
LinkOut - more resources
Full Text Sources
Other Literature Sources
Medical
