. 2016 Sep 1;537(7618):102-106.
doi: 10.1038/nature19328. Epub 2016 Aug 24.

HER2 expression identifies dynamic functional states within circulating breast cancer cells

Affiliations

HER2 expression identifies dynamic functional states within circulating breast cancer cells

Nicole Vincent Jordan et al. Nature. .

Abstract

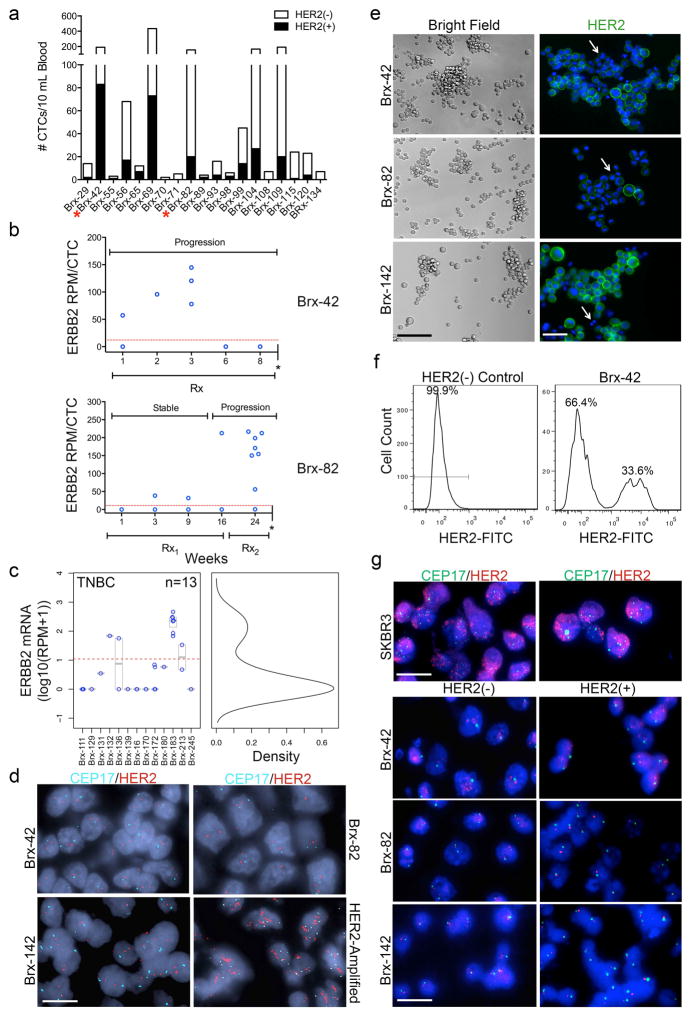
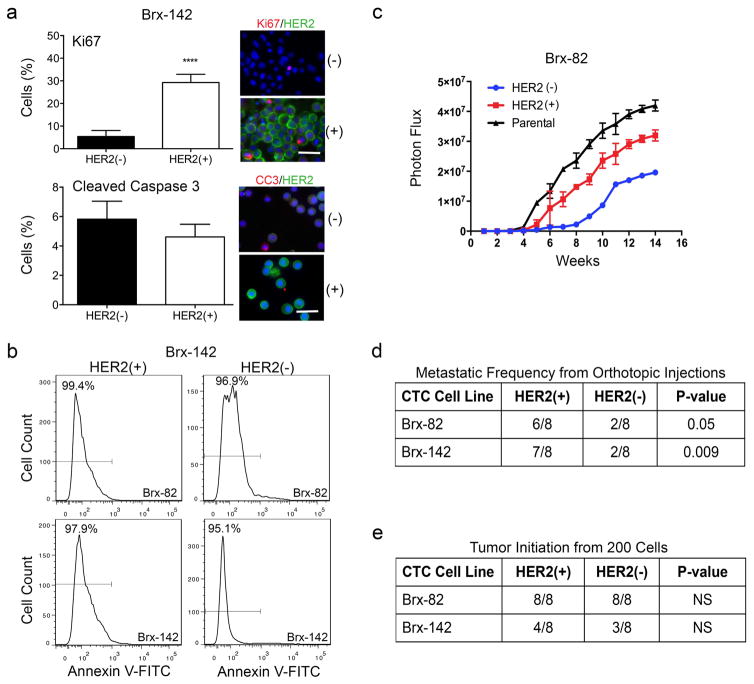
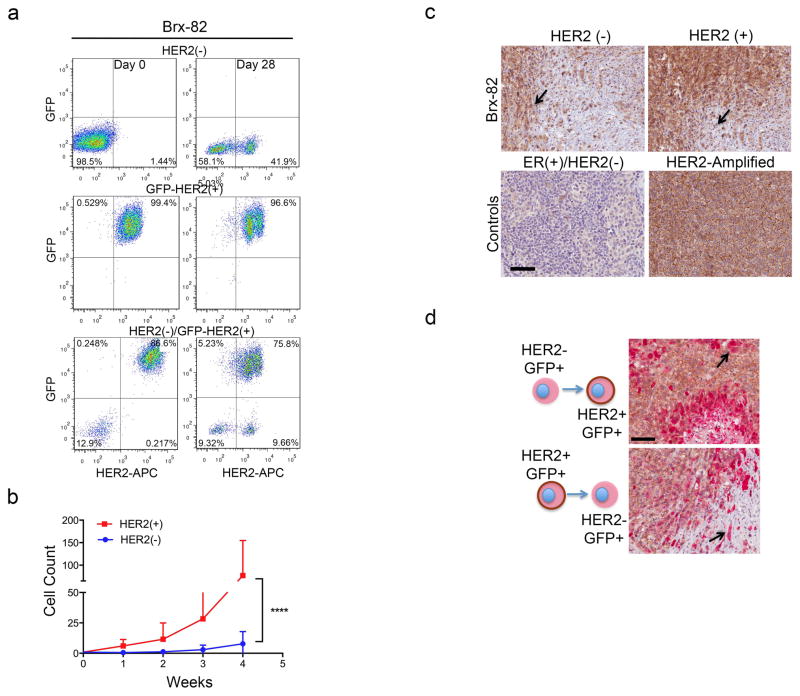
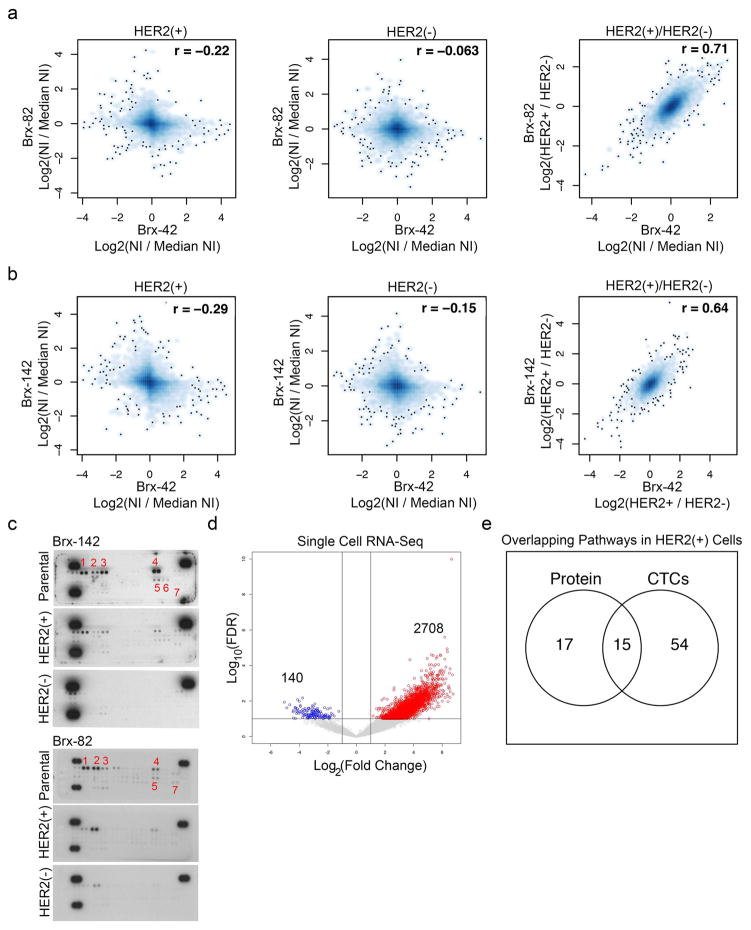
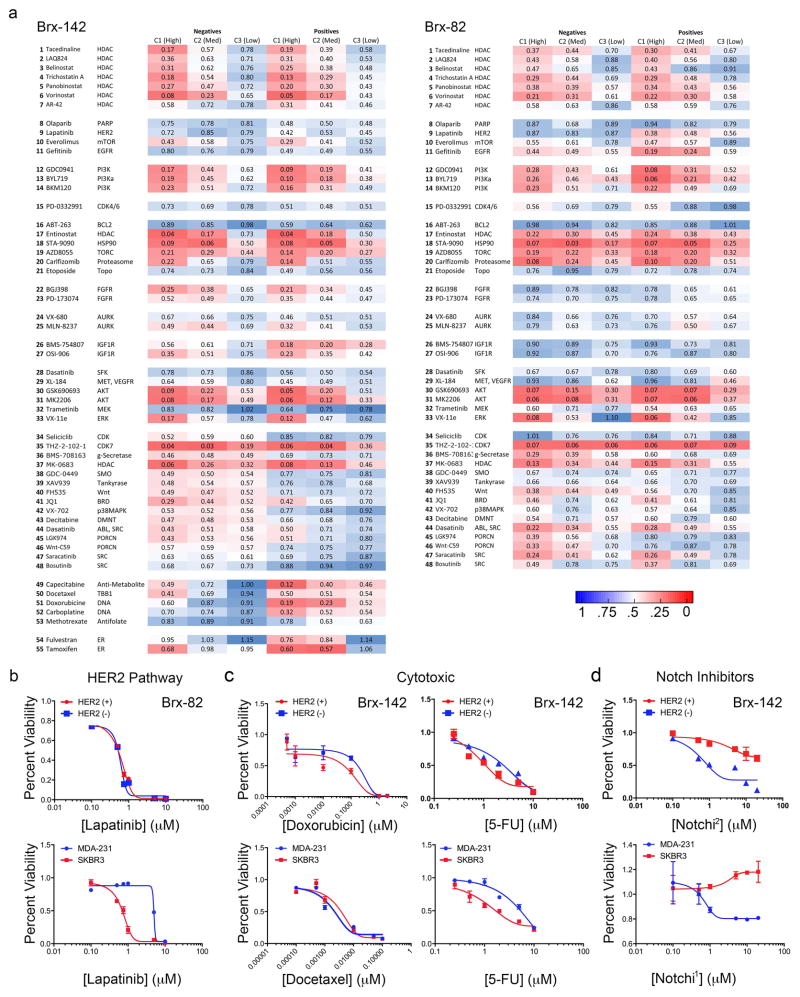
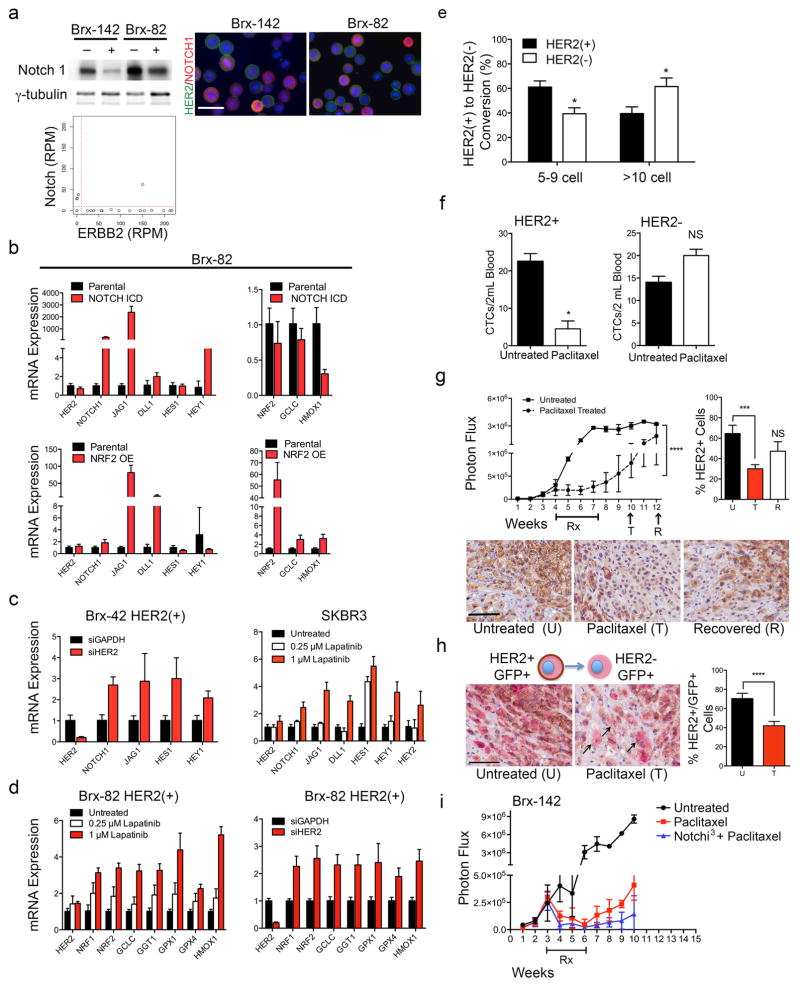
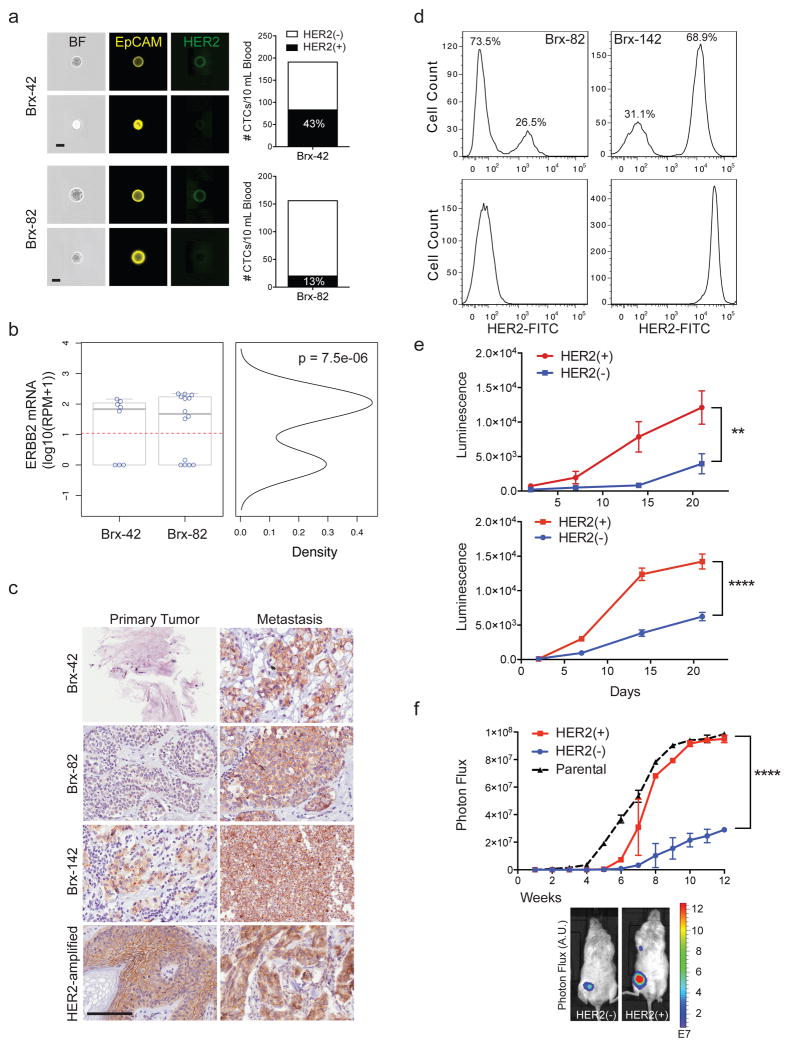
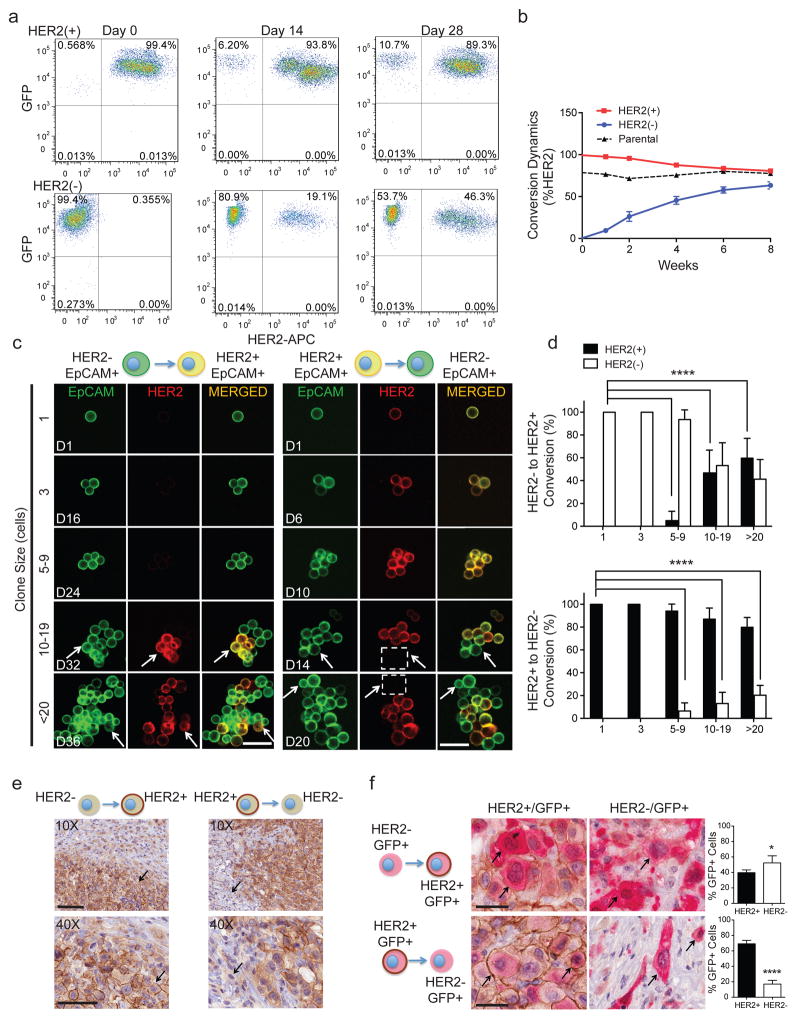
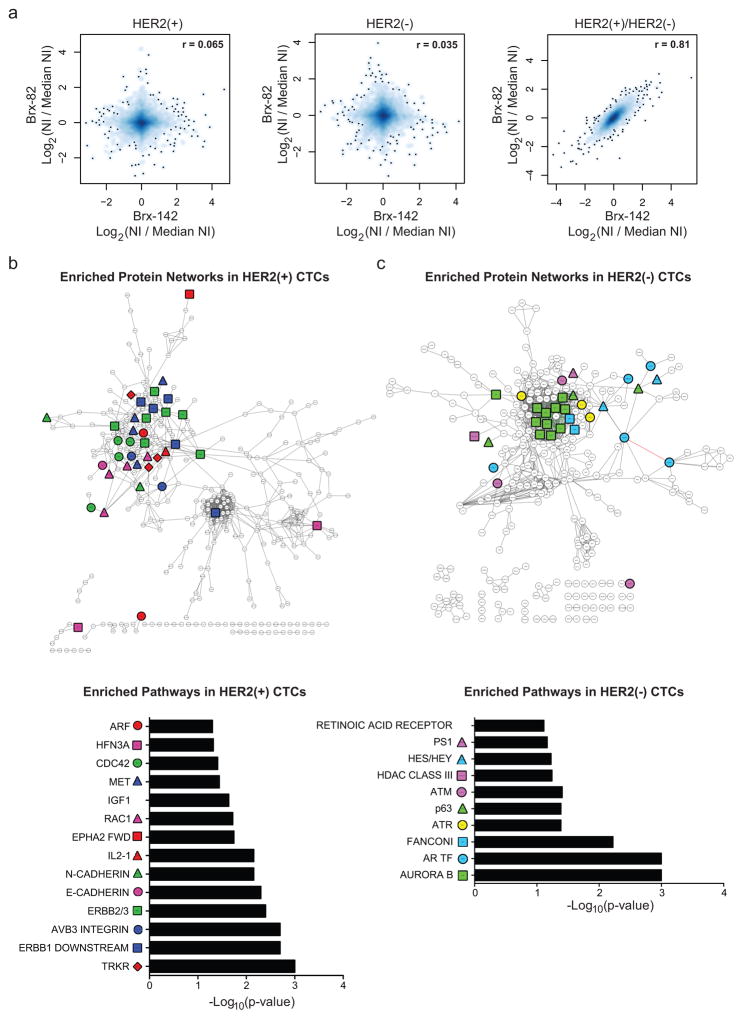
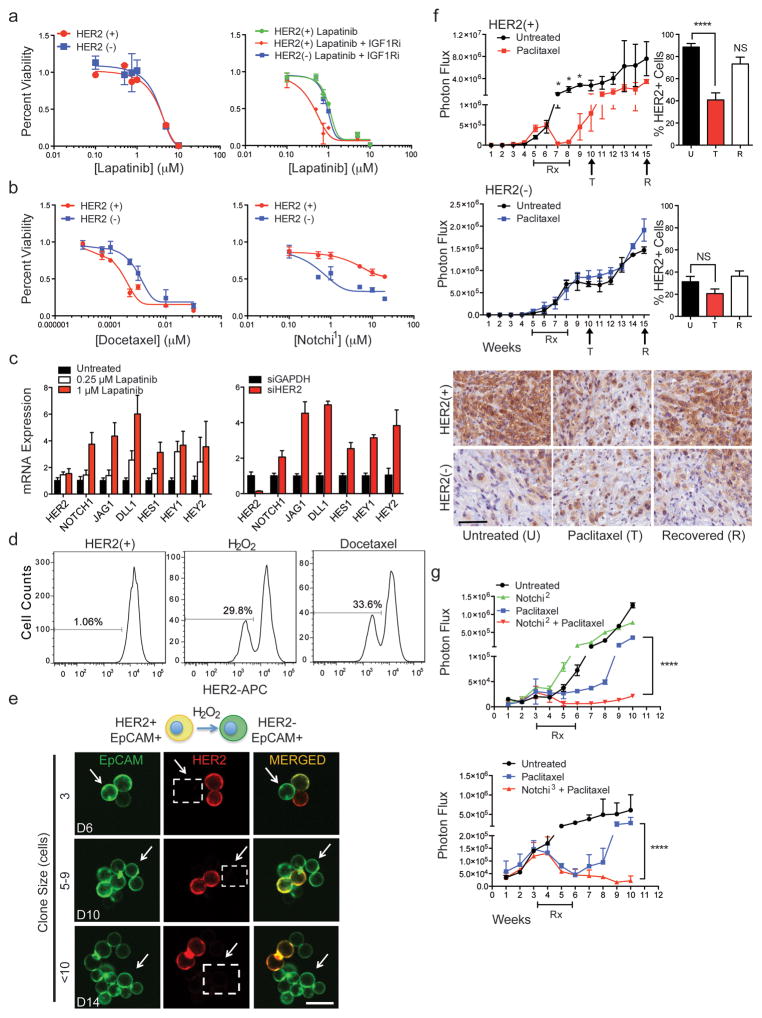
Circulating tumour cells in women with advanced oestrogen-receptor (ER)-positive/human epidermal growth factor receptor 2 (HER2)-negative breast cancer acquire a HER2-positive subpopulation after multiple courses of therapy. In contrast to HER2-amplified primary breast cancer, which is highly sensitive to HER2-targeted therapy, the clinical significance of acquired HER2 heterogeneity during the evolution of metastatic breast cancer is unknown. Here we analyse circulating tumour cells from 19 women with ER+/HER2- primary tumours, 84% of whom had acquired circulating tumour cells expressing HER2. Cultured circulating tumour cells maintain discrete HER2+ and HER2- subpopulations: HER2+ circulating tumour cells are more proliferative but not addicted to HER2, consistent with activation of multiple signalling pathways; HER2- circulating tumour cells show activation of Notch and DNA damage pathways, exhibiting resistance to cytotoxic chemotherapy, but sensitivity to Notch inhibition. HER2+ and HER2- circulating tumour cells interconvert spontaneously, with cells of one phenotype producing daughters of the opposite within four cell doublings. Although HER2+ and HER2- circulating tumour cells have comparable tumour initiating potential, differential proliferation favours the HER2+ state, while oxidative stress or cytotoxic chemotherapy enhances transition to the HER2- phenotype. Simultaneous treatment with paclitaxel and Notch inhibitors achieves sustained suppression of tumorigenesis in orthotopic circulating tumour cell-derived tumour models. Together, these results point to distinct yet interconverting phenotypes within patient-derived circulating tumour cells, contributing to progression of breast cancer and acquisition of drug resistance.


Conflict of interest statement

The authors declare no competing financial interests.

Figures

Extended Data Fig. 1
Extended Data Fig. 1. Advanced ER+/HER2− breast cancer patients harbor discrete HER2+ and HER2− subpopulations
(a) CTCs freshly isolated from 19 ER+/HER2− breast cancer patients were stained with HER2 (yellow) and EpCAM (green) and imaged using imaging flow cytometry. Bar graph shows the number of HER2+ (black) and HER2− (white) CTCs (median 22% HER2+ CTCs, range 4–58%). Supplemental Table 1 provides HER2+/HER2− ratios and each patient’s clinical history. (b) scRNA-seq for ERBB2 expression at multiple time-points showing acquisition of HER2+ CTCs (Brx-82, Brx-42) over the course of progressive disease. Single asterisk (*) denotes patient expiration. Rx = Sacituzumab (IMMU-132); Rx1 = Vinorelbine + Trastuzumab; Rx2 = Eribulin. (c) Distinct HER2+ and HER2− CTCs from 13 TNBC patients determined by scRNA-seq (HER2− ≤ 0 read per million (RPM); HER2+ > 153, range 33–463). (d) HER2 FISH analysis of metastatic tumors from patients, Brx-42, Brx-82 and Brx-142, shows no amplification of ERBB2 compared to HER2-amplified control (Supplemental Table 1 for tumor source data). HER2 (red); chromosome enumeration probe 17 (CEP17) (cyan); Scale bar: 10 μm. Representative image from 5 independent fields are shown. (e) Bright field and IF (DAPI, blue; HER2, green) images of CTC lines, Brx-42, Brx-82 and Brx-142, demonstrate heterogeneity in HER2 expression. Scale bar: 100 μm (bright field); 20 μm (IF). Representative image from 3 independent fields are shown. (f) FACS analysis shows two distinct HER2+ and HER2− subpopulations in the CTC line Brx-42 (at initiation) compared to HER2− control. Representative data of two independent experiments are shown. (g) HER2 FISH analysis of the HER2+ and HER2− subpopulations from CTC lines Brx-42, Brx-82 and Brx-142 shows that the ERBB2 is not amplified. HER2-amplified SKBR3 cells shown as control. HER2 (red); CEP17 (green); Scale bar: 10 μm. Representative images from 5 independent fields are shown.
Extended Data Fig. 2
Extended Data Fig. 2. HER2+ and HER2− subpopulations exhibit distinct functional properties
(a) Increased expression of the proliferation marker Ki67 (red) in the HER2+ subpopulation of CTC line Brx-142 (T-test p < 0.0001), compared with HER2− subpopulation, with no change in cleaved-caspase 3 (red). HER2+ cells (green); scale bar: 20 μm. Representative image from five independent fields are shown. (b) FACS analysis for the apoptotic marker Annexin V-FITC shows no difference in apoptosis between the HER2+ and HER2− subpopulations of FACS-purified CTC line Brx-142. Representative data from two independent experiments are shown. (c) Tumors initiated by HER2+ or HER2− CTCs (Brx-82: 200,000 cells) orthotopically injected into the mammary fat pad show differential growth rates; n=8. (d) Metastatic frequency of HER2+ and HER2− cultured CTCs (Brx-82: p=0.05 and Brx-142: p=0.009) following orthotopic injection; n=8. (e) Limiting dilution experiments demonstrate comparable tumor-initiating ability from 200 HER2+ and HER2− cultured CTCs (Brx-82, Brx-142); n=8.
Extended Data Fig. 3
Extended Data Fig. 3. Dynamics of HER2+ and HER2− interconversion
(a) FACS purified HER2+ and HER2− subpopulations from CTC line Brx-82 were monitored over 28 days to determine shifts in the composition of sorted populations. Representative data of two independent experiments are shown. (b) Growth curves for HER2+ (red) and HER2− (blue) FACS-purified single cell clones from CTC line Brx-142; Two-way ANOVA p-value < 0.0001; n=20. (c) IHC HER2 staining of tumor xenografts derived from unlabeled HER2− and HER2+ CTCs showing acquisition/loss of HER2 (brown), respectively. Arrows indicate regions of HER2 acquisition/loss. Representative image from at least 5 independent fields; n=8. ER+/HER2− and HER2-amplified breast cancers are shown below as controls. (d) Low magnification (landscape) view of HER2 IHC staining of tumor xenografts derived from mixed HER2+ and HER2− CTC cultures containing either GFP-tagged HER2+/HER2− cells (high magnification images are shown in Figure 2f). Upper panel: representative GFP-tagged HER2− cells give rise to GFP+/HER2+ cells (GFP: cytoplasmic red stain, HER2: cell surface brown stain). Lower panel: GFP-tagged HER2+ cells produce GFP+/HER2− cells. Scale bar: 100 μm.
Extended Data Fig. 4
Extended Data Fig. 4. Proteomic and scRNA-Seq analysis of HER2+ versus HER2− cells
(a–b) MS-based whole cell proteome profiles (6349 proteins) comparing HER2+ and HER2− populations from CTC lines (Brx-42, Brx-82, Brx-142). Matched HER2+ versus HER2− proteomic differences show significant linear correlation (Pearson correlation coefficient = 0.71 between Brx-82 and Brx-42; Pearson correlation coefficient = 0.64 between Brx-142 and Brx-42); NI = Normalized Intensity; n=2 per cell line are shown. (c) Phospho-RTK array of HER2+ and HER2− populations of CTC cell lines Brx-142 and Brx-82 show increased phosphorylation of RTKs in the HER2+ population. Numbers denote: 1. HER2; 2. HER3; 3. HER4; 4. INSR; 5. EPHA1; 6. EPHA2; 7. AXL. Representative data from two independent experiments are shown. (d) Volcano plot depicts genes enriched in HER2+ (red) and HER2− (blue) individual CTCs isolated from patients Brx-42 and Brx-82 and analyzed by scRNA-seq; n=22. (e) Venn diagram showing overlap of genes and proteins derived from scRNA-seq (Brx-42, Brx-82) and quantitative proteomics of HER2+ CTCs, respectively.
Extended Data Fig. 5
Extended Data Fig. 5. 55-panel drug screen shows differential drug sensitivities exhibited by HER2+ versus HER2− subpopulations
(a) Heat map showing percent cell viability (represented as decimal) after 6 days drug treatment of the HER2+ and HER2− subpopulations derived from CTC lines Brx-142 and Brx-82. Red and blue represent high and low drug sensitivities, respectively; n=6. (b) Lapatinib sensitivity of HER2+ (red) and HER2− (blue) subpopulations of CTC line Brx-82. MDA-231 (TNBC) and SKBR3 (HER2-amplified) are shown as controls. (c) Chemosensitivity of HER2+ (red) and HER2− (blue) subpopulations of CTC line Brx-142. MDA-231 and SKBR3 are shown as controls. (d) Sensitivity of HER2+ (red) and HER2− (blue) subpopulations of CTC line Brx-142 to Notch inhibition with Notchi1 (BMS-708163) and Notchi2 (RO4929097). MDA-231 and SKBR3 cells are shown as controls. (a–d) Represent at least two independent experiments for each condition; n=6.
Extended Data Fig. 6
Extended Data Fig. 6. NOTCH1 expression and activity in HER2− CTCs
(a) Western blot analysis of HER2+ and HER2− subpopulations from CTC lines BRx-142 and Brx-82 show increased NOTCH1 in HER2− cells. γ-tubulin is shown as control. IF analysis and scRNA-seq of NOTCH1 (red) and HER2 (green) shows inversely correlated expression in CTC lines (Brx-142, Brx-82). (b) Ectopic expression of constitutively-active Notch intercellular domain (ICD) or NRF2 results in increased expression of the Notch1 ligand JAG1 but does not alter HER2 expression. Representative data of two independent experiments are shown; S.E.M (error bars). (c) siRNA-mediated inhibition of HER2 in Brx-42 HER2+ CTCs, and lapatinib-mediated inhibition of HER2 in SKBR3 cells results in dose dependent increases in the expression of genes involved in Notch signaling (NOTCH1, JAG1, DLL1, HES1, HEY1, HEY2). Representative data of two independent experiments are shown; S.E.M (error bars). (d) Inhibition of HER2 using lapatinib or siRNA knockdown in Brx-82 HER2+ CTCs increases the expression of NRF2-driven cytoprotective genes downstream of Notch. Representative data of two independent experiments are shown; S.E.M. (error bars). (e) Quantitation of the interconversion of HER2+ cells from single cell clones into 5–9-cell and >10-cell clusters following treatment with 10mM H2O2; T-test p-value < 0.05; n=10. (f) Paclitaxel treatment of mice with tumors derived from Brx-142 FACS purified HER2+ CTCs, demonstrating a reduction in CTCs and no change in HER2− CTC counts; T-test p <0.05; NS=Not Significant. (g) Paclitaxel treatment of mice with mammary xenografts derived from parental CTC line Brx-142 showing initial tumor response, followed by recurrent tumor growth. IHC analysis and quantitation of the recurrent tumor shows greatly reduced HER2+ (brown stain) cell composition in the Paclitaxel drug treated (T, 3-weeks post-treatment) tumor compared with the untreated tumor (U) and the recovered tumor (R, 5-weeks post-treatment). Bar indicates duration of drug treatment (Rx). Scale bar = 100 μm; Two-way ANOVA p-value < 0.0001; n=8. Representative images from 5 independent fields per tumor are shown and quantified; T-test p <0.001. (h) Dual GFP (red, cytoplasmic stain) and HER2 (brown, cell surface stain) IHC of tumor xenografts derived from mixed GFP-tagged HER2+ and untagged HER2− CTC cultures demonstrating enhanced conversion from GFP+/HER2+ to GFP+/HER2− following 4-weeks paclitaxel treatment; T-test p-value < 0.0001; n=8. Scale bar: 100 μm. Arrows indicate interconverting cells. Representative images from 5 independent fields per tumor are shown. (i) Mouse tumor xenografts derived from the CTC cell line Brx-142 treated with a combination of the Notchi3 (LY-414575) and paclitaxel shows diminished tumor relapse; n=8. Bar indicates treatment duration.
Figure 1
Figure 1. Distinct properties of HER2+ and HER2− CTC subpopulations from patients with advanced ER+/HER2− breast cancer
(a) Quantitation by imaging flow cytometry of HER2+ and HER2− CTCs isolated from patients Brx-42, Brx-82. EpCAM (yellow) and HER2 (green). Scale bar: 10 μm. (b) Bimodal distribution of ERBB2 RNA-seq reads from single CTCs, Hartigans’ dip test p = 7.5e-6, n=22 (HER2− ≤ 1 read per million (RPM); HER2+ > 133, range 32–217). (c) IHC for HER2 (brown) in matched metastatic vs primary tumors (Brx-42, Brx-82, Brx-142) compared to HER2-amplified tumor (control). Scale bar: 100 μm; Tumor data (Supplemental Table 1). (d) FACS of cultured CTCs, showing discrete HER2+ and HER2− subpopulations. MDA-231 (TNBC) and SKBR3 (HER2-amplified) cells are shown as control. (e) Differential proliferation of FACS-purified HER2+ (red) and HER2− (blue) subpopulations from cultured CTCs; Two-way ANOVA p < 0.01 (Brx-82), p < 0.0001 (Brx-142); n=6; S.D. (error bar). (f) Increased in vivo growth of orthotopic mammary tumors derived from FACS-purified, HER2+ CTCs compared with HER2- cells; n=8; Two-way ANOVA p < 0.0001; S.D. (error bar).
Figure 2
Figure 2. Interconversion of HER2+ and HER2− phenotypes
(a) FACS-purified GFP-tagged HER2+ and HER2− CTCs generate HER2− (upper panels) and HER2+ cells (lower panels), respectively. (b) Time-course of HER2+/HER2− interconversion following FACS-isolation of HER2+ (red) and HER2− (blue) cells; n=3; S.D. (error bar). Parental cultured CTCs (black dotted) are shown as control. (c) Representative confocal microscopic images depicting HER2+/HER2− interconversion within single cell-derived clones at indicated timepoints (D=days) and colony sizes. EpCAM (green), HER2 (red) and MERGED (gold). Scale bar: 20 μm; n=20. Arrows and dashed boxes indicate interconverting cells, with loss/gain of HER2. (d) Quantitation of HER2+/HER2− interconversion from single cell-derived colonies at each colony size; T-test p-value < 0.0001; n=20; S.D. (error bar). (e) Gain/loss of HER2+ cells (brown, arrow) in tumor xenografts derived from purified HER2− (left)/HER2+ (right) CTCs. Scale bar: 100 μm (upper panels); 50 μm (lower panels); n=8. (f) IHC imaging and quantitation of GFP+/HER2+ cells within tumors generated from GFP-tagged/HER2− and untagged HER2+ CTCs (upper panels), and the converse (lower panels). GFP: cytoplasmic red, HER2: membrane brown. Scale bar: 20 μm; T-test p-value <0.05 (*), p-value < 0.0001 (****); n=8; S.D. (error bar).
Figure 3
Figure 3. Molecular pathways differentially activated in HER2− versus HER2+ cultured CTCs
(a) Comparison of quantitative MS proteomes (6349 proteins) showing distinct profiles for individual cultured CTCs (Brx-82, Brx-142), but linear correlation between proteins differentially expressed in HER2+ and HER2− subpopulations; NI = Normalized Intensity; n=2 biological replicates per CTC line Brx-42, Brx-82, Brx-142 (Supplemental Table 3). (b–c) Cytoscape network maps (upper panels) and GSEA pathway analysis (lower panels) depicting proteins enriched by greater than log2(0.5) by quantitative MS in (b) HER2+ and (c) HER2− CTCs (GSEA FDR ≤ 0.25; Nominal p-value cut-off < 0.05; Supplemental Table 4). Colored shapes represent proteins within denoted pathways. Red asterisks highlight RTK pathways in (b) and Notch pathways in (c).
Figure 4
Figure 4. Cooperative targeting of HER2+ and HER2− CTC subpopulations suppresses tumor growth
(a) HER2+ CTCs show no change in sensitivity to lapatinib alone, compared with matched HER2− CTCs (Brx-142), but have increased sensitivity to combined HER2 and IGF1R (BMS-754807) inhibitors; n=6; S.D (error bar). (b) HER2− CTCs demonstrate reduced chemosensitivity (docetaxel) but have enhanced sensitivity to Notch inhibition (BMS-708163, Notchi1), compared with HER2+ CTCs; n=6; S.D. (error bar). (c) Inhibition of HER2 with lapatinib or siRNA-mediated knockdown in HER2+ CTCs (Brx-82) results in dose-dependent increase of Notch-related genes: NOTCH1, JAG1, DLL1, HES1, HEY1, HEY2; p <0.05; n=6; S.E.M (error bar). (d) Rapid emergence (96 hrs) of HER2− CTCs following treatment of HER2+ CTCs with H2O2 (10 mM) or docetaxel (1 nM). (e) Confocal microscopy showing rapid appearance of HER2− progeny (3 cell) from single-CTC derived HER2+ colonies treated with H2O2. EpCAM (green), HER2 (red) and MERGED (gold). Scale bar: 20 μm; n=10. Arrows and dashed boxes indicate cells with loss of HER2 at indicated timepoints (D=days). (f) Paclitaxel treatment (4 weeks) of mice with CTC-derived (Brx-142) orthotopic mammary tumors. Upper panel: HER2+/HER2− tumor growth curves with paclitaxel treatment; Lower panels: Representative IHC for HER2 (brown) in HER2+ and HER2− derived tumors at the U (untreated), T (2-weeks post-treatment) and R (7-weeks post-treatment) timepoints. Scale bar: 100 μm; p-value T-test < 0.05 n=8; p-value < 0.05. (g) Simultaneous treatment (4 weeks) of mammary xenografts (Brx-82) with paclitaxel and either Notch inhibitor RO4929097 (Notchi2) or LY-411575 (Notchi3), showing sustained responses for the combination, compared with paclitaxel alone. Rx denotes treatment duration; Two-way ANOVA p-value < 0.0001 n=8.

References

    1. Arteaga CL, Engelman JA. ERBB Receptors: From Oncogene Discovery to Basic Science to Mechanism-Based Cancer Therapeutics. Cancer Cell. 2014;25:282–303. - PMC - PubMed
    1. Houssami N, Macaskill P, Balleine RL, Bilous M, Pegram MD. HER2 discordance between primary breast cancer and its paired metastasis: tumor biology or test artefact? Insights through meta-analysis. Breast Cancer Res Treat. 2011;129:659–674. - PubMed
    1. Ozkumur E, et al. Inertial Focusing for Tumor Antigen-Dependent and -Independent Sorting of Rare Circulating Tumor Cells. Science Translational Medicine. 2013;5:179ra47–179ra47. - PMC - PubMed
    1. Yu M, et al. Ex vivo culture of circulating breast tumor cells for individualized testing of drug susceptibility. Science. 2014;345:216–220. - PMC - PubMed
    1. Ting L, Rad R, Gygi SP, Haas W. MS3 eliminates ratio distortion in isobaric multiplexed quantitative proteomics. Nat Meth. 2011;8:937–940. - PMC - PubMed

Publication types

MeSH terms