. 2016 Aug 24:5:e15657.
doi: 10.7554/eLife.15657.

An integrative transcriptomic atlas of organogenesis in human embryos

Affiliations

An integrative transcriptomic atlas of organogenesis in human embryos

Dave T Gerrard et al. Elife. .

Abstract

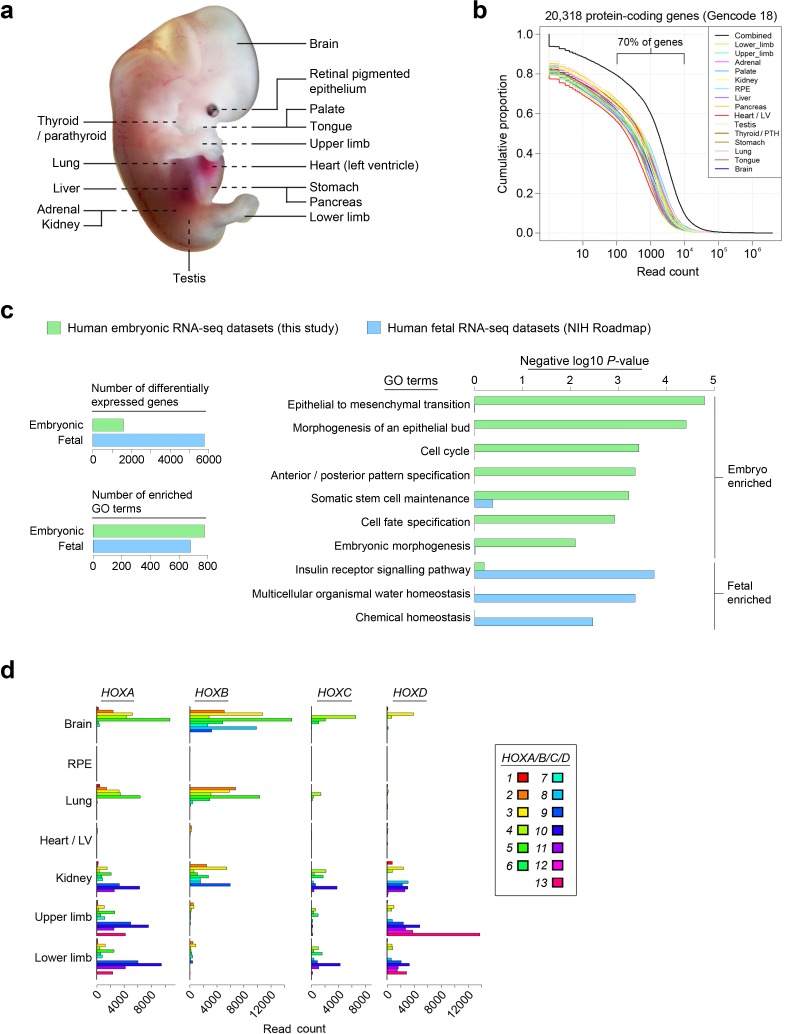
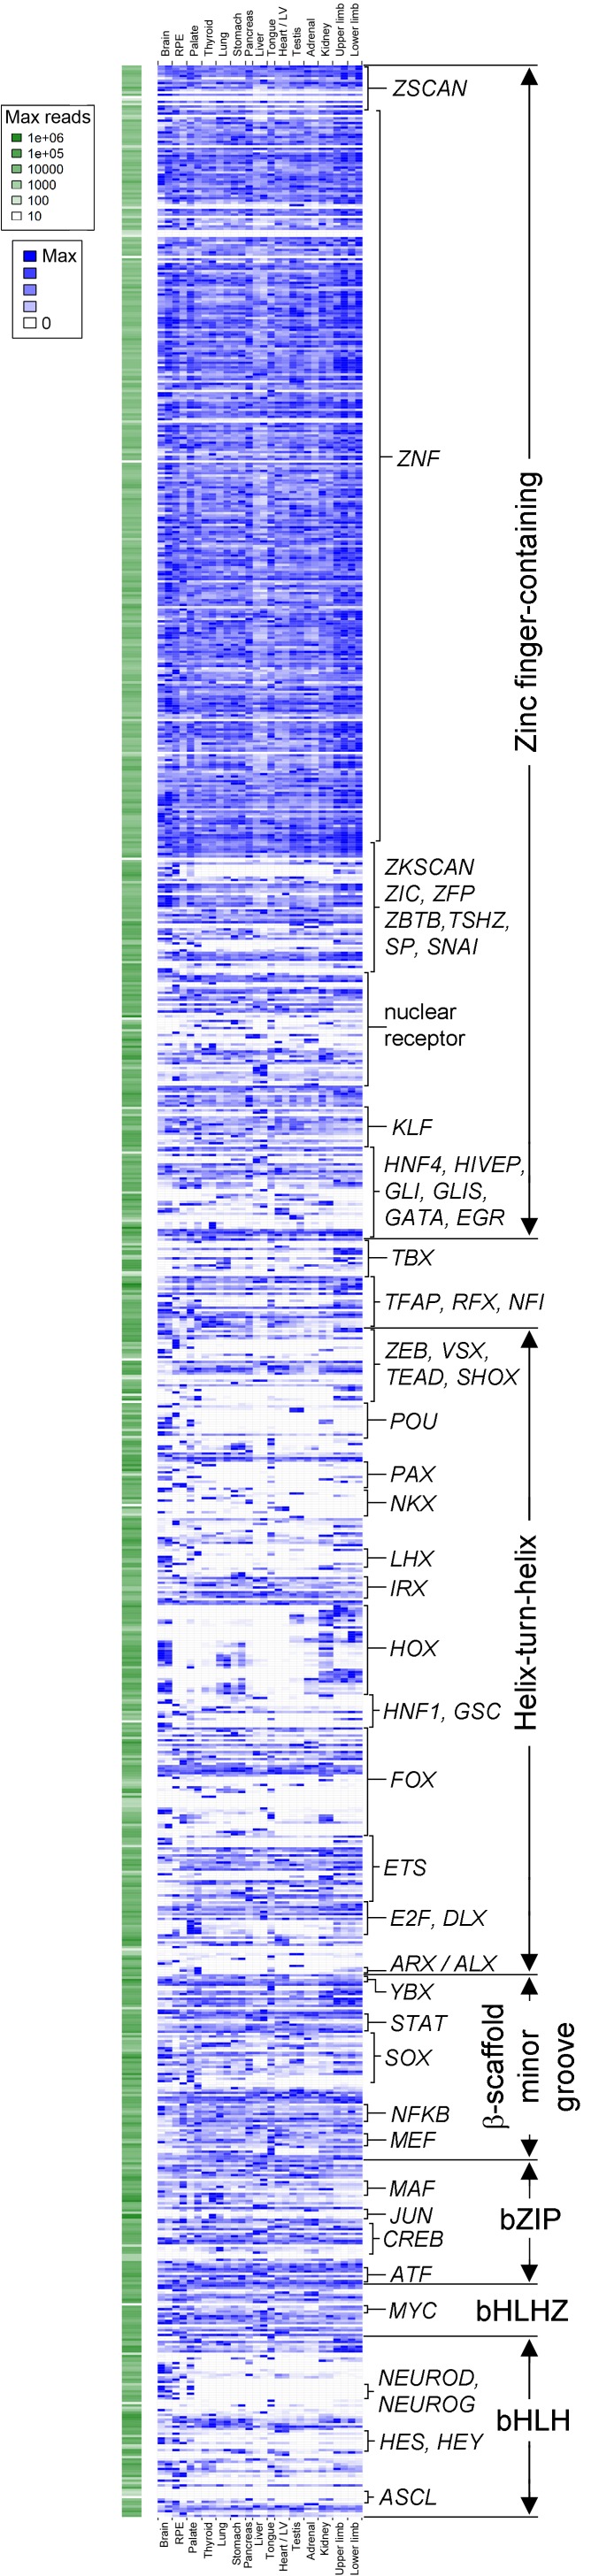
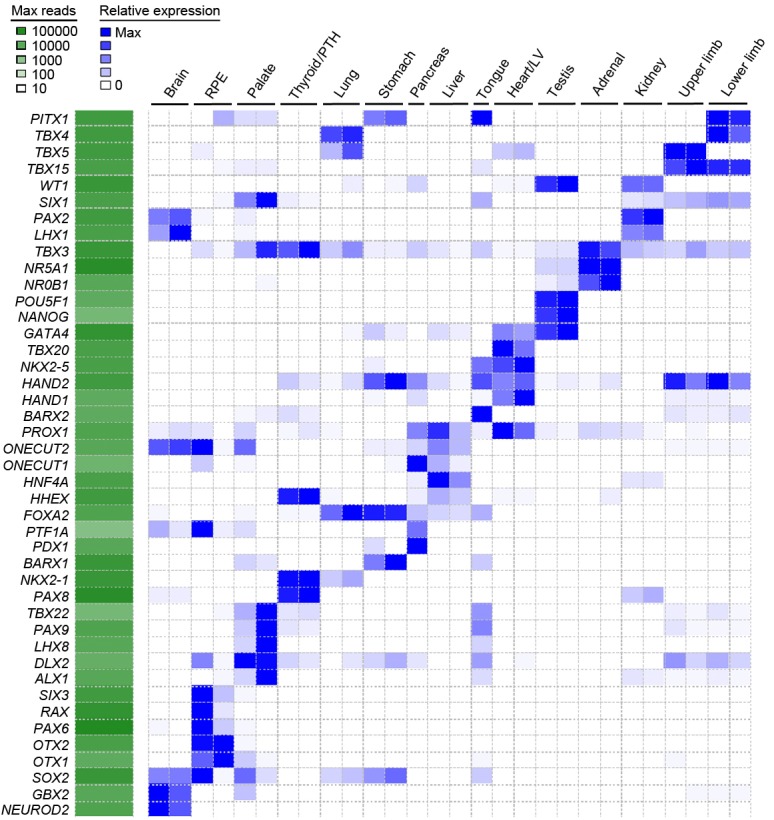
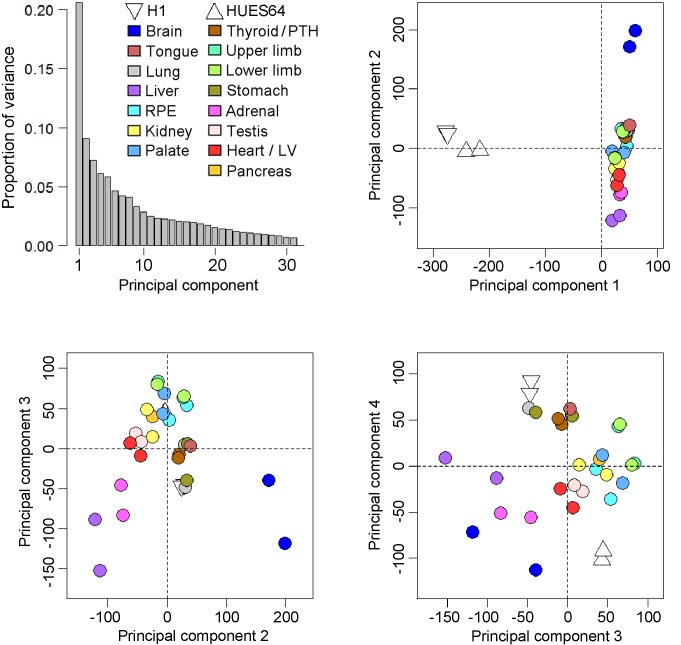
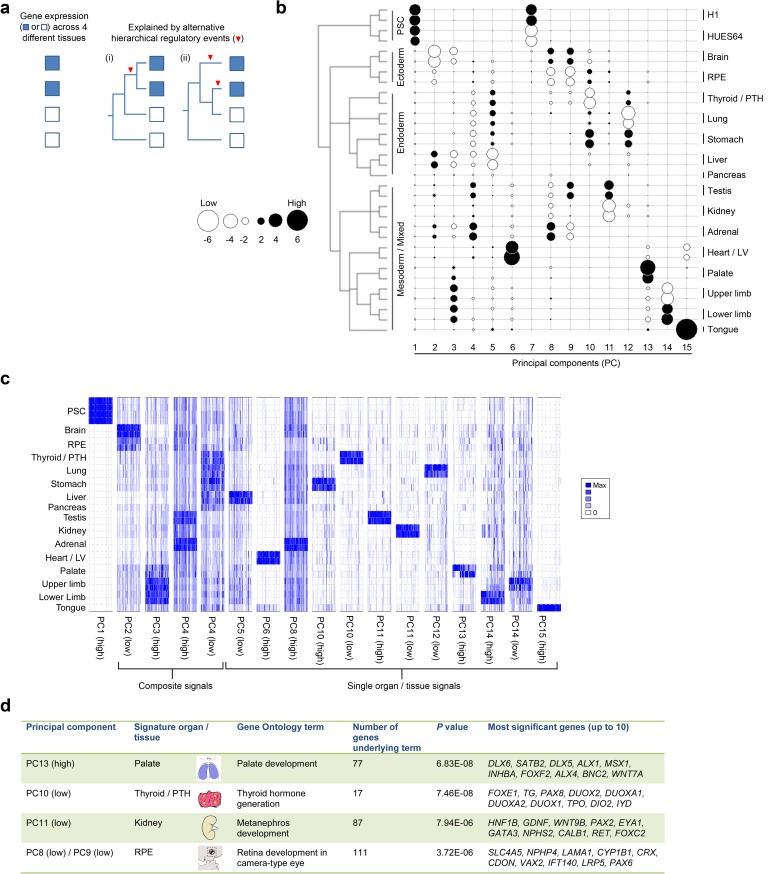
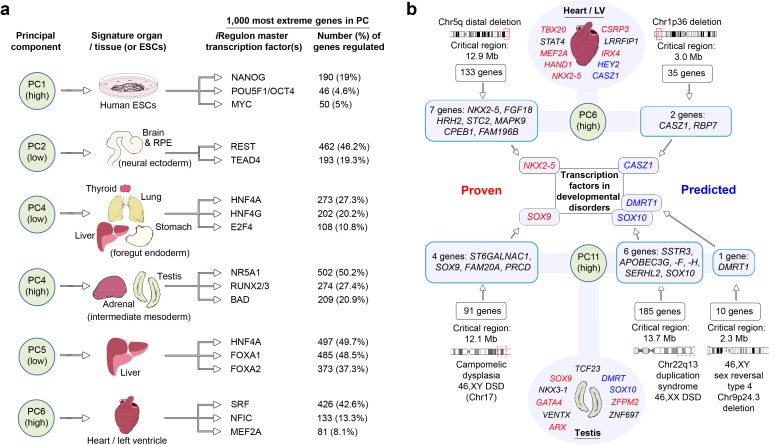
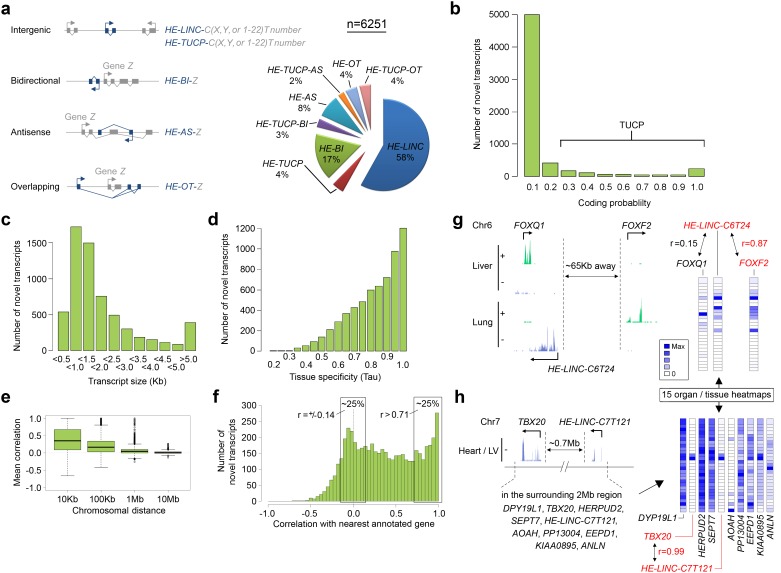
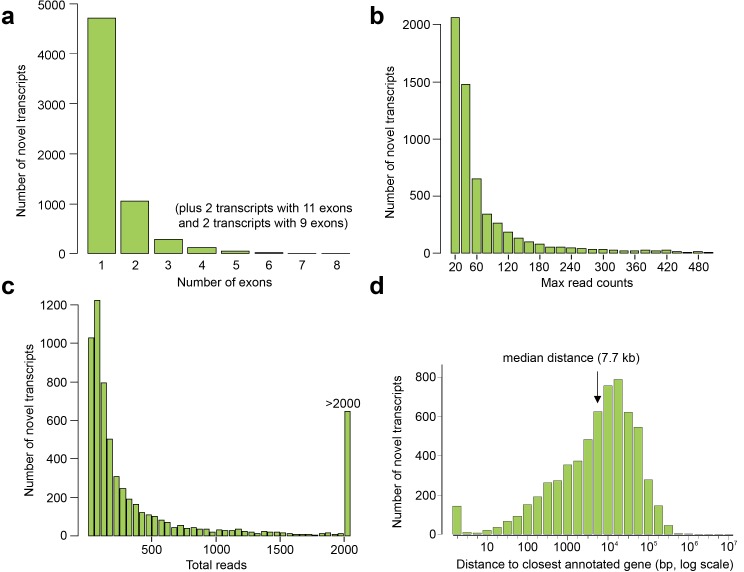
Human organogenesis is when severe developmental abnormalities commonly originate. However, understanding this critical embryonic phase has relied upon inference from patient phenotypes and assumptions from in vitro stem cell models and non-human vertebrates. We report an integrated transcriptomic atlas of human organogenesis. By lineage-guided principal components analysis, we uncover novel relatedness of particular developmental genes across different organs and tissues and identified unique transcriptional codes which correctly predicted the cause of many congenital disorders. By inference, our model pinpoints co-enriched genes as new causes of developmental disorders such as cleft palate and congenital heart disease. The data revealed more than 6000 novel transcripts, over 90% of which fulfil criteria as long non-coding RNAs correlated with the protein-coding genome over megabase distances. Taken together, we have uncovered cryptic transcriptional programs used by the human embryo and established a new resource for the molecular understanding of human organogenesis and its associated disorders.

Keywords: developmental biology; embryo; human; human biology; medicine; organogenesis; rna-seq; stem cells; transcriptome.


Conflict of interest statement

The authors declare that no competing interests exist.

Figures

Figure 1.
Figure 1.. Profiling the transcriptomes underlying organogenesis in human embryos.
(a) Human embryo showing the 15 tissues and organs subjected to RNA-seq. (b) High dynamic range of human embryonic RNA-seq. The combined dataset (black) included expression of >90% of annotated protein-coding genes (GENCODE18 [Harrow et al., 2012]). (c) Human embryogenesis possesses a distinctive transcriptome. Human embryonic read counts were compared with equivalent fetal datasets from NIH Roadmap (Roadmap Epigenomics Consortium, 2015) using edgeR (Robinson et al., 2010) and a false discovery rate (FDR) of 0.05 (see Materials and methods, Supplementary file 1B). Negative log10 p-values are shown for selected biological process Gene Ontology (GO) terms with significant enrichment in either the embryonic or fetal gene sets following Fisher's exact test applied using the elimination algorithm (Alexa and Rahnenfuhrer, 2010) (Supplementary file 1C contains the full list of enriched terms). (d) Selected sites illustrate the highly specific expression of HOX genes within the human embryo. DOI: http://dx.doi.org/10.7554/eLife.15657.003
Figure 1—figure supplement 1.
Figure 1—figure supplement 1.. Transcription factor atlas of human organogenesis.
Heatmap of gene expression for all transcription factors annotated on KEGG (http://www.genome.jp/kegg-bin/get_htext?hsa03000) across the fifteen different human embryonic organs and tissues. Absolute maximum values of expression for each gene are represented to the left (green). The relative expression of each transcription factor across tissues is shown to the right (blue) set against its own maximum value (threshold for inclusion, read count >100 in at least one tissue). A high resolution version, text-searchable for each individual transcription factor, is available as Supplementary file 5. B, brain; R, retinal pigmented epithelium; P, palate; Th, thyroid / parathyroid; Lu, lung; S, stomach; Pan, pancreas; L, liver; To, tongue; H, heart / left ventricle; Te, testis; A, adrenal; K, kidney; UL, upper limb; and LL, lower limb. DOI: http://dx.doi.org/10.7554/eLife.15657.004
Figure 1—figure supplement 2.
Figure 1—figure supplement 2.. Heatmap of user-defined transcription factors indicates organ and tissue specificity during human organogenesis.
To validate that tissue-specific signatures should be readily attainable from the global dataset several transcription factors for each organ or tissue were selected based on recognized published roles and mutant mouse phenotypes (data available from Mouse Genome Informatics, www.informatics.jax.org). The heatmap demonstrates clear tissue-specificity. DOI: http://dx.doi.org/10.7554/eLife.15657.005
Figure 1—figure supplement 3.
Figure 1—figure supplement 3.. Principal components analysis of the human embryonic transcriptomes.
Across the four principal components biological replicates clustered together but from global pairwise correlations only the brain and to a lesser extent the liver were clearly distinct from the other organs and tissues (either extreme of principal component 2). As part of the reason why the liver was distinctive the five most abundant genes (ALB, AFP and three fetal hemoglobins) accounted for >20% of the data whereas in the other datasets the top 5 genes were responsible for only ~5% of transcription. The overall conclusion was that the simple principal components analysis failed to segregate clearly the individual transcriptomes of the different organs and tissues, an outcome that led to the development of the LgPCA methodology. Four samples from two human pluripotent stem cell (PSC) lines, H1 and HUES64 (NIH Roadmap datasets), are included here because they were subsequently included in the LgPCA analysis (Figure 2). The PSC lines are clearly distinct from the primary human embryonic tissue samples (negative loadings in principal component 1). DOI: http://dx.doi.org/10.7554/eLife.15657.006
Figure 1—figure supplement 4.
Figure 1—figure supplement 4.. Heatmap of RNA-seq samples.
Samples are clustered based on Spearman’s rank correlation across all annotated genes. RNA-seq batch is indicated in the colored key to the left. In this study, RNA sequencing was performed in 3 batches. The pancreas RNA-seq was re-used from a previous study (Cebola et al., 2015). Four samples from two human pluripotent stem cell (PSC) lines, H1 and HUES64 (NIH Roadmap datasets), are included here because they were subsequently included in the LgPCA analysis (Figure 2). The PSC lines are clearly distinct from the primary human embryonic tissue samples. DOI: http://dx.doi.org/10.7554/eLife.15657.007
Figure 1—figure supplement 5.
Figure 1—figure supplement 5.. NMF Metagene analysis.
(a) Subsets of tissue-specific genes (‘metagenes’) were found using non-negative matrix factorisation (NMF) (Gaujoux and Seoighe, 2010). The initial screen using the co-phenetic distance suggested 11 exclusive metagenes. The NMF was re-run 200 times to assess consistency of sample groupings between runs. The resulting metagenes were discriminatory for liver, heart / left ventricle, adrenal gland, RPE, brain and thyroid / parathyroid while others sample types formed heterogeneous clusters: for instance, lung, stomach and tongue (metagene 9); kidney & testis (metagene 3); and limbs and palate (metagene 6). (b) NMF metagene analysis demonstrates enrichment of expression for those genes comprising metagene 2 (liver) in fresh human hepatocytes and human embryonic stem cells differentiated towards hepatocytes but not in human embryonic fibroblasts [sequence data from (Du et al., 2014)] compared to the other metagenes. DOI: http://dx.doi.org/10.7554/eLife.15657.008
Figure 2.
Figure 2.. Lineage-guided PCA discovers unique transcriptional signatures regulating human organogenesis.
(a) Interpreting gene expression profiles is dependent upon the underlying developmental lineage. Similar expression profiles in closely related tissues imply fewer regulatory events. (b) Lineage-guided principal components analysis (LgPCA) constrains PCA by imposing a developmental lineage on the different organs and tissues. The first 15 PCs are shown including biological replicates for the human embryonic organs and tissues integrated with human embryonic stem cell data (Roadmap Epigenomics Consortium, 2015). PC scores for the 15 different dimensions are shown in black (positive/high) or white (negative/low) with scale (extremeness) indicated by circle size (sign/direction is arbitrary). Unique transcriptional signatures were resolved for broad organ groupings (e.g. foregut endoderm derivatives, low scores in PC4), single organs or tissues (e.g. palate, high scores in PC13) or across tissues unrelated by germ layer but connected by multisystem congenital disorders (e.g. heart and limb, low scores in PC13). (c) Heatmaps of quantile normalised expression values of the most extreme 50 genes for selected PCs from the LgPCA. (d) Gene Ontology (GO) terms and their underlying genes illustrate the specific signatures from the LgPCA (further examples in Supplementary file 1F). DOI: http://dx.doi.org/10.7554/eLife.15657.009
Figure 2—figure supplement 1.
Figure 2—figure supplement 1.. Lineage-guided principal components analysis (LgPCA) for all 31 PCs.
LgPCA showing all 31 PCs illustrating that global patterns (i.e. strong lineage and organ or tissue level signatures) emerge from the earlier PCs (≤PC15 to the left) while local patterns (e.g. heterogeneity between samples) become evident at ≥PC16, to the right). Many individual PCs gave very clear organ or tissue-specific signatures, however, the transcriptomes of most organs and tissues can also be represented by a composite of patterns visible across a number of different PCs. DOI: http://dx.doi.org/10.7554/eLife.15657.010
Figure 3.
Figure 3.. LgPCA points to master regulators of human organogenesis and the causes of human congenital disorders.
(a) Predicted regulation by iRegulon (Janky et al., 2014) of the most extreme 1000 genes for different PCs identifies known and unexpected transcription factors regulating human organogenesis. In several examples, individual transcription factors (e.g. REST, NR5A1, HNF4A, FOXA1 and SRF) were predicted to regulate nearly half of the most extreme 1000 genes. (b) Transcription factors at the extremes of individual PCs in the LgPCA are responsible for a diverse range of congenital disorders (red names in the ovals for heart and testis; full details in Supplementary file 1G). To validate the utility of these data, we conservatively selected some of the earliest critical regions for these disorders (two ‘Proven’ examples on the left; all 53 listed in Supplementary file 1H). LgPCA frequently isolated the correct transcription factor from an average of 111 genes across >10 Mb, shown for NKX2-5 in congenital heart disease and SOX9 in campomelic dysplasia. Beyond this validation LgPCA similarly predicts causative transcription factors (blue) for many unresolved congenital disorders such as developmental heart abnormalities in Chr1p36 deletion syndrome and sex reversal / disorders of sex differentiation (DSD) (all 13 examples in Supplementary file 1H). DOI: http://dx.doi.org/10.7554/eLife.15657.011
Figure 4.
Figure 4.. 6251 novel transcripts identified during human organogenesis show low coding probability and high tissue-specificity.
(a) Novel transcript models were merged across tissues (n = 9180; Supplementary file 4), assessed for coding potential using CPAT and classified (Mattick and Rinn, 2015) as overlapping (OT), antisense (AS), bidirectional (BI), intergenic noncoding (LINC) and/or transcripts of uncertain coding potential (TUCP, if CPAT >0.2). LINC or TUCP transcripts were numbered sequentially (T number) along each chromosome (C, either X, Y or 1–22) whereas BI, AS and OT transcripts were named by association with the annotated gene (‘Z’). A small proportion of transcripts fulfilled dual criteria as BI/AS/OT and TUCP. 6251 unique, non-overlapping, filtered transcript models were identified (the longest from each locus, >200 bp; Supplementary file 1I). (b) Histogram of coding probability determined using CPAT (Wang et al., 2013). 9% of transcripts were classed as TUCP. The small proportion with clear open reading frames (CPAT score = 1.0) were predominantly OT transcripts. (c) Distribution by size of transcript. 114 transcripts were >10 Kb. (d) Tissue specificity was calculated using Tau (Yanai et al., 2005) based on the mean normalized read counts for each tissue or organ site. 80% of transcripts showed Tau values >0.7 indicating high tissue specificity. Details on exon and read counts, and proximity to surrounding genes are shown in Figure 4—figure supplement 1. (e) Box and whisker plots show the correlation between expression of the novel transcripts and surrounding annotated genes within set chromosomal distances of the novel transcriptional start site. Mean correlation was near zero beyond 1 Mb. (f) Histogram showing the correlation (r) between expression of each novel transcript and its closest annotated gene. One quarter of novel transcripts show a correlation (r > 0.71) with the nearest gene; another quarter shows minimal correlation (r = ±0.14). There was no strong anticorrelation. g-h, Expression of the novel transcript is not always correlated with the immediately adjacent gene, illustrated by heatmaps across the 15 organs and tissues. (g) Expression of the novel transcript, HE-LINC-C6T24, located just over 2 Kb from FOXQ1, correlates strongly with FOXF2, approximately 65 Kb distant. (h) Heatmap demonstrates the poor correlation of expression between HE-LINC-C7T121 and most of the nine genes within 1 Mb on Chr7 but near perfect correlation with TBX20 located ~0.7 Mb away beyond two intervening genes. DOI: http://dx.doi.org/10.7554/eLife.15657.012
Figure 4—figure supplement 1.
Figure 4—figure supplement 1.. Exon and read counts and distance to the nearest annotated gene for the novel human embryonic transcripts.
(ac) Histograms showing the number of exons (a), maximum read count for each transcript in any one tissue (b), and total reads (i.e. summed across all tissues) for each transcript (c). (d) Distance to the transcriptional start site (TSS) of the nearest annotated gene (GENCODE18) from the TSS of the novel transcript. DOI: http://dx.doi.org/10.7554/eLife.15657.013

Comment in

  • How to build a human.
    Mellough CB, Lako M. Mellough CB, et al. Elife. 2016 Aug 24;5:e19826. doi: 10.7554/eLife.19826. Elife. 2016. PMID: 27557445 Free PMC article.

References

    1. Alexa A, Rahnenfuhrer J. http://bioconductor.org/packages/topGO/ Bioconductor. (topGO: topGO: Enrichment Analysis for Gene Ontology) 2010
    1. Bolstad B. http://bioconductor.org/packages/preprocessCore/ Bioconductor. (preprocessCore: A Collection of Pre-Processing Functions) 2007
    1. Brunet J-P, Tamayo P, Golub TR, Mesirov JP. Metagenes and molecular pattern discovery using matrix factorization. PNAS. 2004;101:4164–4169. doi: 10.1073/pnas.0308531101. - DOI - PMC - PubMed
    1. Cebola I, Rodríguez-Seguí SA, Cho CH, Bessa J, Rovira M, Luengo M, Chhatriwala M, Berry A, Ponsa-Cobas J, Maestro MA, Jennings RE, Pasquali L, Morán I, Castro N, Hanley NA, Gomez-Skarmeta JL, Vallier L, Ferrer J. TEAD and YAP regulate the enhancer network of human embryonic pancreatic progenitors. Nature Cell Biology. 2015;17:615–626. doi: 10.1038/ncb3160. - DOI - PMC - PubMed
    1. Cotney J, Leng J, Yin J, Reilly SK, DeMare LE, Emera D, Ayoub AE, Rakic P, Noonan JP. The evolution of lineage-specific regulatory activities in the human embryonic limb. Cell. 2013;154:185–196. doi: 10.1016/j.cell.2013.05.056. - DOI - PMC - PubMed

Publication types

LinkOut - more resources